Niangua: Fire Incidents, Missouri (MO)
Where are fire incidents reported in Niangua, MO
Something went wrong! Please refresh the page.
|
| |||||||||||||||||||||||||||||||||||||||||||||||||||||||||||||||||||||||||||||||||||||||||||||||||||||||||||||
2002 - 2018 National Fire Incident Reporting System (NFIRS) incidents
- Incident types reported to NFIRS in Niangua, MO
- 28054.6%Rescue & EMS
- 15630.4%Fire
- 519.9%Good Intent Call
- 122.3%Hazardous Condition
- 112.1%False Alarm
- 20.4%Service Call
- 10.2%Special Incident
- Fire incident types reported to NFIRS in Niangua, MO
- 8453.8%Outside Fires
- 5334.0%Structure Fires
- 106.4%Mobile Property/Vehicle Fires
- 95.8%Other
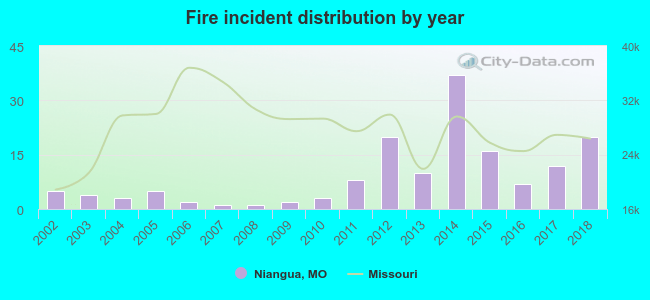 According to the data from the years 2002 - 2018 the average number of fire incidents per year is 9. The highest number of fires - 37 took place in 2014, and the least - 1 in 2007. The data has a rising trend.
 48.1% incidents where reported in the morning and 51.9% in the evening. The most fires (17.9%) took place on Sunday, and the least (9.0%) on Monday.
 According to the 156 fire incident reports from years 2002 - 2018 most fires (16.0%) took place during January, and the least (3.2%) in June.
 Out of all 513 cases reported during the years 2002 - 2018, the most belonged to the categories: Overpressure Rupture (54.6%), Fire (30.4%), and Service Call (9.9%).
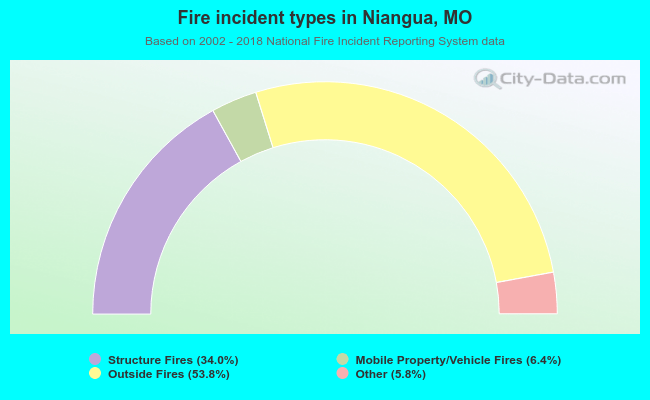 When looking into fire subcategories, the most incidents belonged to: Outside Fires (53.8%), and Structure Fires (34.0%).