Nickerson: Fire Incidents, Kansas (KS)
Where are fire incidents reported in Nickerson, KS
Something went wrong! Please refresh the page.
|
| |||||||||||||||||||||||||||||||||||||||||||||||||||||||||||||||||||||||||||||||||||||||||||||||||||||||||||||
2002 - 2018 National Fire Incident Reporting System (NFIRS) incidents
- Incident types reported to NFIRS in Nickerson, KS
- 33746.7%Fire
- 23031.9%Hazardous Condition
- 598.2%Good Intent Call
- 527.2%Rescue & EMS
- 223.1%Service Call
- 152.1%Severe Weather
- 30.4%False Alarm
- 20.3%Special Incident
- 10.1%Overpressure Rupture
- Fire incident types reported to NFIRS in Nickerson, KS
- 19658.2%Outside Fires
- 8124.0%Structure Fires
- 3911.6%Mobile Property/Vehicle Fires
- 216.2%Other
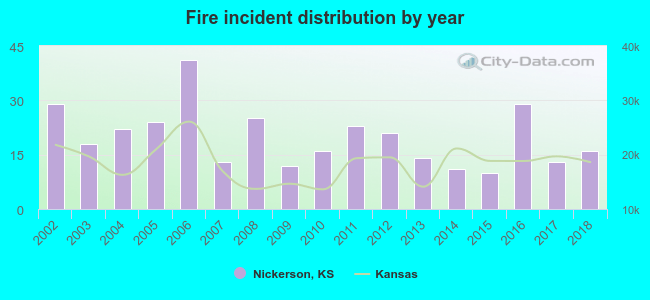 Based on the data from the years 2002 - 2018 the average number of fire incidents per year is 20. The highest number of fires - 41 took place in 2006, and the least - 10 in 2015. The data has a decreasing trend.
 23.1% incidents where reported in the morning and 76.9% in the evening. The most fires (18.1%) took place on Tuesday, and the least (10.1%) on Monday.
 According to the 337 fire incident reports from years 2002 - 2018 most fires (16.9%) took place during July, and the least (4.5%) in October.
 Out of all 721 cases reported during the years 2002 - 2018, the most belonged to the categories: Fire (46.7%), Hazardous Condition (31.9%), and Good Intent Call (8.2%).
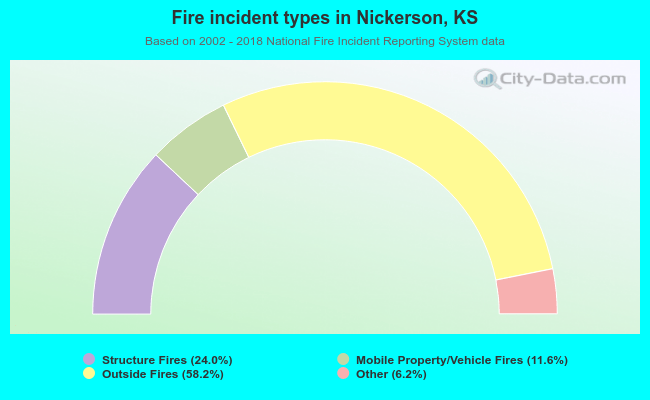 When looking into fire subcategories, the most reports belonged to: Outside Fires (58.2%), and Structure Fires (24.0%).