Norfolk: Fire Incidents, Nebraska (NE)
Where are fire incidents reported in Norfolk, NE
Something went wrong! Please refresh the page.
| Fire incidents reported | |
|---|---|
| Sreet name | Count |
| 1ST ST | 156 |
| NORFOLK AVE | 142 |
| OMAHA AVE | 132 |
| 13TH ST | 112 |
| PASEWALK AVE | 86 |
| 3RD ST | 76 |
| BENJAMIN AVE | 76 |
| EISENHOWER AVE | 70 |
| VICTORY RD | 66 |
| OLD HADAR RD | 48 |
| RIVERSIDE BLVD | 48 |
| 4TH ST | 46 |
| PHILLIP AVE | 44 |
| 9TH ST | 40 |
| 18TH ST | 36 |
| 5TH ST | 36 |
| KOENIGSTEIN AVE | 34 |
| MONROE AVE | 34 |
| 12TH ST | 32 |
| 25TH ST | 32 |
| PARK AVE | 32 |
| 10TH ST | 30 |
| 11TH ST | 28 |
| 13TH PL | 28 |
| 8TH ST | 28 |
| ELM AVE | 28 |
| 7TH ST | 26 |
| HIGHWAY 275 | 26 |
| SHERWOOD RD | 26 |
| SOUTH AIRPORT RD | 26 |
| Other | 219 |
2002 - 2018 National Fire Incident Reporting System (NFIRS) incidents
- Incident types reported to NFIRS in Norfolk, NE
- 5,36558.7%Rescue & EMS
- 1,84320.2%Fire
- 6176.7%False Alarm
- 5576.1%Hazardous Condition
- 4945.4%Service Call
- 2212.4%Good Intent Call
- 210.2%Special Incident
- 200.2%Overpressure Rupture
- Fire incident types reported to NFIRS in Norfolk, NE
- 77542.1%Outside Fires
- 59332.2%Structure Fires
- 30616.6%Mobile Property/Vehicle Fires
- 1699.2%Other
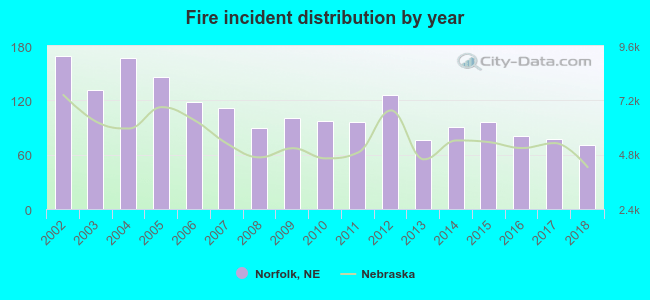 According to the data from the years 2002 - 2018 the average number of fires per year is 108. The highest number of fire incidents - 169 took place in 2002, and the least - 71 in 2018. The data has a decreasing trend.
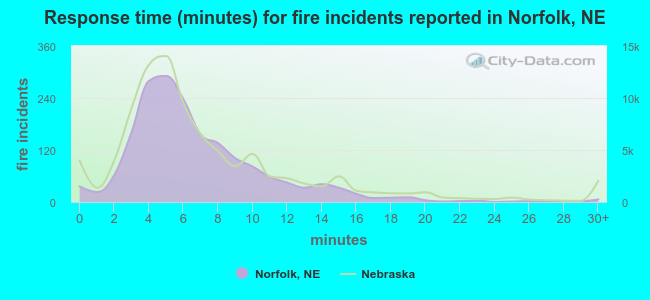 The median response time based on all reported fire incidents is 6 minutes. This is comparable to the Nebraska median value.
The median response time in Norfolk, NE compared to nearest cities:
(Note: Based on data for all years, including only cities with at least 500 fire incidents)
| Norfolk: | 6 minutes |
| Columbus: | 5 minutes |
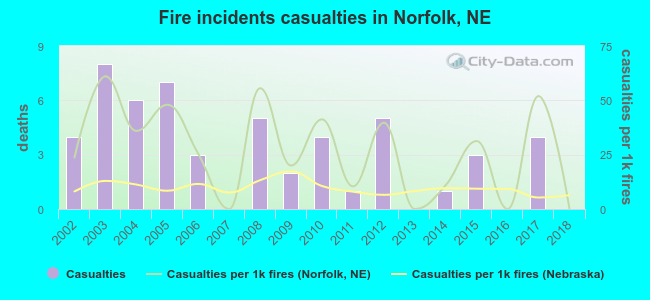 According to the reports from the years 2002 - 2018 the average number of fire-related casualties per year is 3. The highest number of reported casualties - 8 took place in 2003, and the lowest - 0 in 2007. The data has a dropping trend.
The average number of injuries per 1,000 fire incidents is 27. This indicator was the highest - 61 in 2003, and the lowest 0 in 2007. The trend for injuries per 1,000 fire incidents is declining. Compared to the state value the number of injuries per 1,000 fires is much higher.
According to the reports from the years 2002 - 2018 the average number of fire-related casualties per year is 3. The highest number of reported casualties - 8 took place in 2003, and the lowest - 0 in 2007. The data has a dropping trend.
The average number of injuries per 1,000 fire incidents is 27. This indicator was the highest - 61 in 2003, and the lowest 0 in 2007. The trend for injuries per 1,000 fire incidents is declining. Compared to the state value the number of injuries per 1,000 fires is much higher.Casualties per 1,000 incidents in Norfolk, NE compared to nearest cities:
(Note: Based on data for all years, including only cities with at least 500 fire incidents)
| Norfolk: | 28.8 |
| Columbus: | 7.1 |
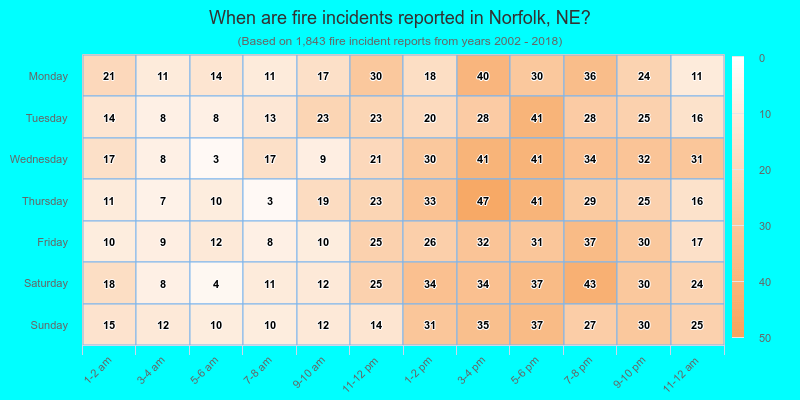
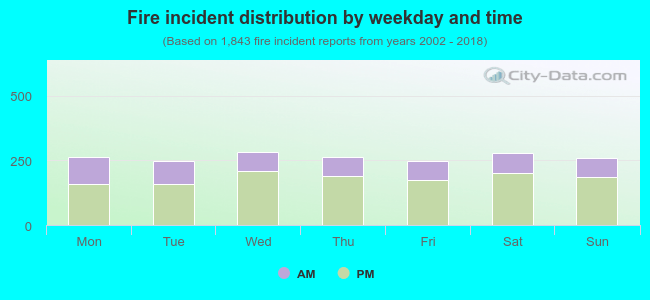 30.7% incidents where reported in the morning and 69.3% in the evening. The most fires (15.4%) took place on Wednesday, and the least (13.4%) on Tuesday.
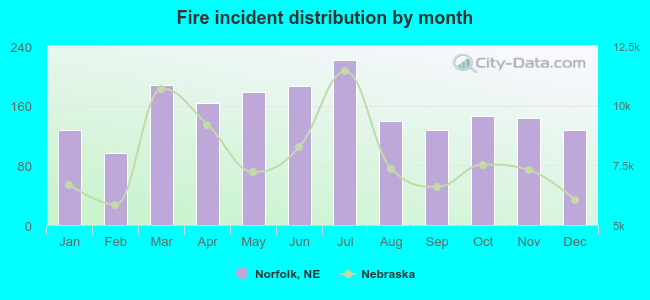 According to the 1,843 fire incident reports from years 2002 - 2018 most fires (12.0%) took place during July, and the least (5.3%) in February.
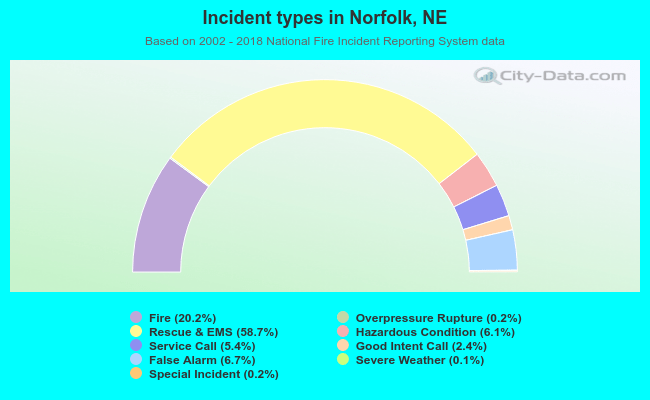 Out of all 9,143 cases reported during the years 2002 - 2018, the most belonged to the categories: Rescue & EMS (58.7%), Fire (20.2%), and False Alarm (6.7%).
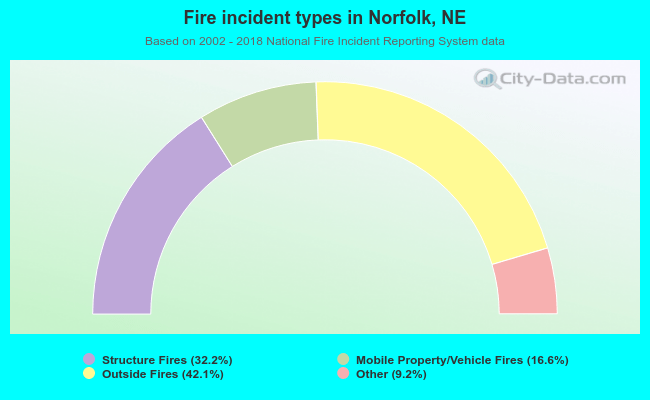 When looking into fire subcategories, the most reports belonged to: Outside Fires (42.1%), and Structure Fires (32.2%).