| Fire incidents reported |
|---|
| Sreet name | Count |
|---|
| I85 HWY | 24 | | US #1 HWY | 22 | | US1 HWY | 18 | | KERR LAKE COLE BRIDGE RD | 14 | | OINE RD | 14 | | I-85 HWY | 12 | | COLLINS ROAD | 10 | | NORLINA PINES DR | 10 | | US 1 N HWY | 10 | | JOHNSON LN | 8 | | US #158 BUSINESS HWY | 8 | | US 1 HWY | 8 | | WARREN PLACE DR | 8 | | WARREN PLAINS RD | 8 | | AXTELL RIDGEWAY RD | 6 | | BROOKS ST | 6 | | CARRIE DUNN RD | 6 | | COUNTRY LN | 6 | | DARDEN ST | 6 | | HARRISON RD | 6 | | JESSE PRIDGEN RD | 6 | | ROOKER DAIRY RD | 6 | | ROOKER DAIRY RD | 6 | | US 1 | 6 | | US158 HWY | 6 |
| | | Fire incidents reported |
|---|
| Sreet name | Count |
|---|
| WISE FIVE FORKS RD | 6 | | 967 U S HWY 1 SOUTH | 4 | | BEAVER DAM RD | 4 | | CARRIE DUNN RD | 4 | | CENTER ST | 4 | | DIVISION ST | 4 | | ELM ST | 4 | | GRAND AVE | 4 | | HAWKS RD | 4 | | HIGH ST | 4 | | MARTIN RD | 4 | | MLK, JR. BLVD | 4 | | PARRIE RD | 4 | | PASCHALL STATION RD | 4 | | POPLAR MOUNT RD | 4 | | RIDGEWAY WARRENTON RD | 4 | | ROOKER ST | 4 | | SHEPPARD-SR 1133 | 4 | | ST.TAMMANY RD | 4 | | US #1 N | 4 | | US HIGHWAY 1 HWY | 4 | | WARREN PLAINS NORLINA RD | 4 | | ZION CHURCH RD | 4 | | 104 NORLINA PINES DRIVE | 2 | | 105 ZION CHURCH ROAD | 2 |
|
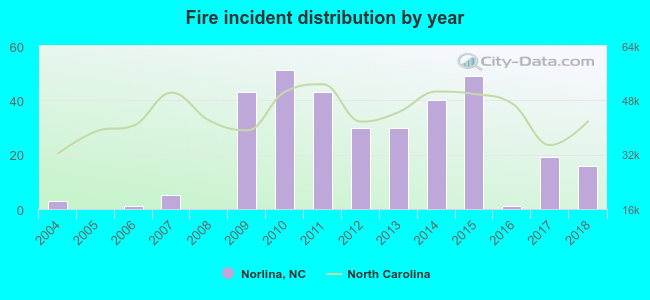 According to the data from the years 2004 - 2018 the average number of fire incidents per year is 22. The highest number of fires - 51 took place in 2010, and the least - 0 in 2005. The data has an increasing trend.
 34.4% incidents where reported in the morning and 65.6% in the evening. The most fires (17.2%) took place on Saturday, and the least (10.6%) on Tuesday.
 Based on the 331 reports from years 2004 - 2018 most fires (13.0%) took place during February, and the least (4.2%) in August.
 Out of all 1,435 cases reported during the years 2004 - 2018, the most belonged to the categories: Overpressure Rupture (37.2%), Fire (23.1%), and Rescue & EMS (21.4%).
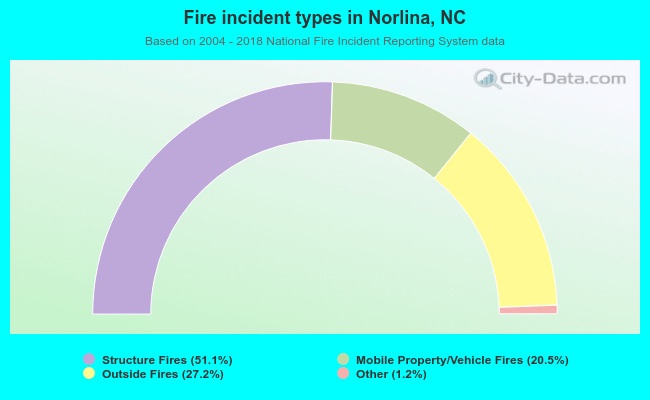 When looking into fire subcategories, the most incidents belonged to: Structure Fires (51.1%), and Outside Fires (27.2%).