| Fire incidents reported |
|---|
| Sreet name | Count |
|---|
| 58 MAIN STREET | 42 | | PROSPECT STREET | 18 | | PROSPECT ST | 6 | | WATER STREET | 6 | | 2 WEST STREET | 4 | | 291 WATER ST | 4 | | 52 MAIN STREET | 4 | | 58 MAIN ST | 4 | | COLLEGE ROAD | 4 | | MAIN STREET | 4 | | NORTH BENNINGTON | 4 | | 1 SCARY LANE | 2 | | 10 HILLSIDE ST | 2 | | 11 WATER STREET | 2 | | 12 PLEASANT ST | 2 | | 126 COLLEGE ROAD | 2 | | 13 HALL ST | 2 | | 15 PROSPECT ST | 2 | | 1614 NORTH BENNINGTON ROAD | 2 | | 18 PROSPECT ST | 2 | | 20 SAGE | 2 | | 20 STATE STREET | 2 | | 206 MATTISON ROAD | 2 | | 2112 RTE 67A | 2 | | 22 SUSAN TAILER LANE | 2 |
| | | Fire incidents reported |
|---|
| Sreet name | Count |
|---|
| 23 BANK ST | 2 | | 2ND STREET | 2 | | 2ND STREET BENNINGTON COLLEGE | 2 | | 32 HALL STREET | 2 | | 436 MATTESON ROAD | 2 | | 436 MATTISON RD | 2 | | 5 ROYAL ST | 2 | | 59 MAIN STREET | 2 | | 645 WATER STREET | 2 | | 758 PARK ST | 2 | | 799 PARK ST | 2 | | 9 MAIN ST | 2 | | 9 SCAREY LANE | 2 | | 940 WATER ST | 2 | | BENNINGTON COLLEGE CAMPUS | 2 | | COLEGE RD | 2 | | COLLEGE DR. | 2 | | DUNHAM AVE #10 | 2 | | HALL ST | 2 | | HALL ST | 2 | | HOMESTEAD MEWS | 2 | | LAKE PARAN RD | 2 | | LAKE PARIN ROAD | 2 | | MAIN | 2 | | NASH ST | 2 |
|
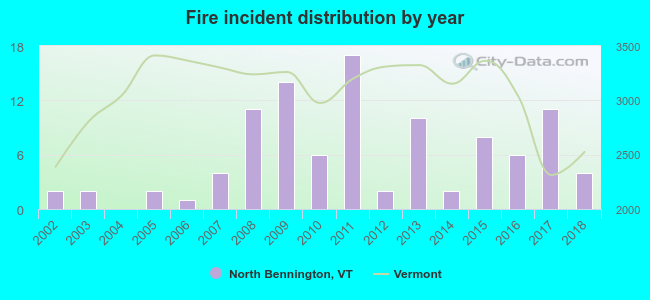 Based on the data from the years 2002 - 2018 the average number of fires per year is 6. The highest number of reported fires - 17 took place in 2011, and the least - 0 in 2004. The data has an increasing trend.
 32.4% incidents where reported in the morning and 67.6% in the evening. The most fires (15.7%) took place on Saturday, and the least (12.7%) on Monday.
 Based on the 102 fires from years 2002 - 2018 most fires (16.7%) took place during April, and the least (2.9%) in December.
 Out of all 292 cases reported during the years 2002 - 2018, the most belonged to the categories: Fire (34.9%), Good Intent Call (23.3%), and Rescue & EMS (17.8%).
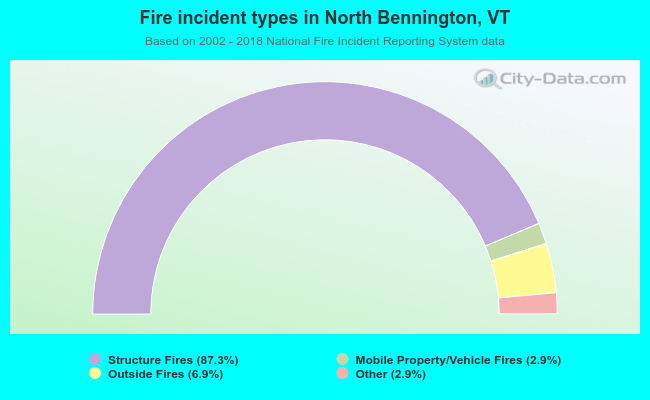 When looking into fire subcategories, the most reports belonged to: Structure Fires (87.3%), and Outside Fires (6.9%).