| Fire incidents reported |
|---|
| Sreet name | Count |
|---|
| BAYSHORE RD | 90 | | TOWN BANK RD | 28 | | BAYSHORE ROAD | 18 | | ACADEMY RD | 12 | | BEACH DR | 12 | | INDIAN AVE | 10 | | RT 109 | 10 | | SEASHORE RD | 10 | | LEAMING AVE | 8 | | ORCHARD DR | 8 | | ROSE ANN AVE | 8 | | TOWN BANK ROAD | 8 | | BEACHHURST DRIVE | 6 | | BEACHURST DR | 6 | | FERRY ROAD | 6 | | FIRE LA | 6 | | HUGHES AVE | 6 | | OLD MILL DR | 6 | | APPLEBLOSSOM DR | 4 | | BAYWOOD DR | 4 | | BREAKWATER TERRACE TER | 4 | | CEDARBROOK DR | 4 | | CHARLES W. SANDMAN BLVD | 4 | | CLUB HOUSE DR | 4 | | CROYDEN DR | 4 |
| | | Fire incidents reported |
|---|
| Sreet name | Count |
|---|
| DELAND AVE | 4 | | ENGLEWOOD AVE | 4 | | HARMONY RD | 4 | | HEMLOCK RD | 4 | | HEMMLOCK DR | 4 | | JONATHAN HOFFMAN RD | 4 | | PACIFIC AVE | 4 | | ROSEANN AVENUE | 4 | | SCOTT AVE | 4 | | SHORE DR | 4 | | SHUNPIKE RD | 4 | | TOWNBANK RD | 4 | | WASHINGTON BLVD | 4 | | WINSLOW AVE | 4 | | # 10 OSPREY CT. | 2 | | #10 OSPREY COURT | 2 | | 17 FIELD VIEW RD. | 2 | | 506 WASHINGTON AVE. | 2 | | 708 WAYNE AVE. | 2 | | 902 SHUNPIKE | 2 | | ADMIRALS CT | 2 | | ADRIATIC AVE | 2 | | ADRIATIC AVENUE | 2 | | AMHURST AVE | 2 | | |
|
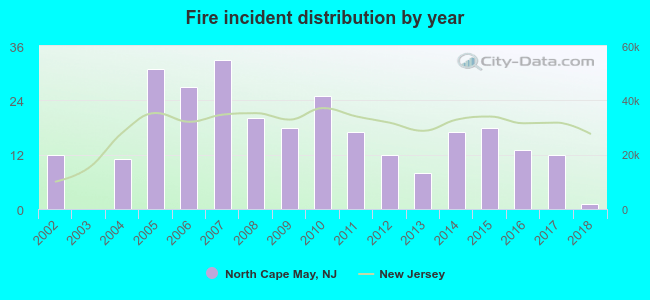 According to the data from the years 2002 - 2018 the average number of fire incidents per year is 16. The highest number of fires - 33 took place in 2007, and the least - 0 in 2003. The data has a declining trend.
 37.8% incidents where reported in the morning and 62.2% in the evening. The most fires (17.5%) took place on Tuesday, and the least (11.6%) on Thursday.
 According to the 275 incident reports from years 2002 - 2018 most fires (10.9%) took place during April, and the least (4.7%) in February.
 Out of all 928 cases reported during the years 2002 - 2018, the most belonged to the categories: Hazardous Condition (37.9%), Fire (29.6%), and False Alarm (22.7%).
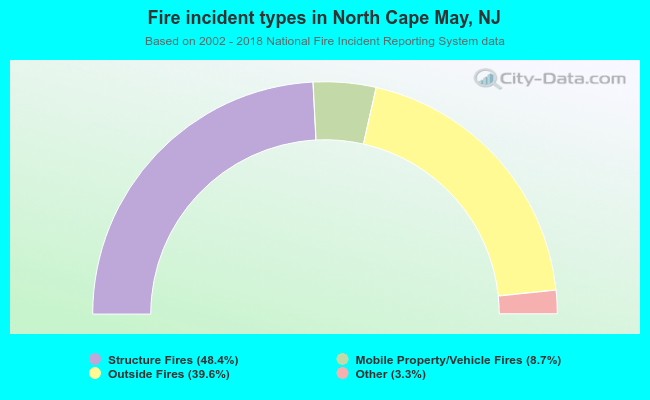 When looking into fire subcategories, the most reports belonged to: Structure Fires (48.4%), and Outside Fires (39.6%).