North Hampton: Fire Incidents, New Hampshire (NH)
Where are fire incidents reported in North Hampton, NH
Something went wrong! Please refresh the page.
|
| |||||||||||||||||||||||||||||||||||||||||||||||||||||||||||||||||||||||||||||||||||||||||||||||||||||||||||||
2002 - 2018 National Fire Incident Reporting System (NFIRS) incidents
- Incident types reported to NFIRS in North Hampton, NH
- 2,96648.5%Rescue & EMS
- 83713.7%Hazardous Condition
- 82713.5%Good Intent Call
- 62110.2%Service Call
- 4226.9%False Alarm
- 4016.6%Fire
- 290.5%Severe Weather
- 90.1%Overpressure Rupture
- Fire incident types reported to NFIRS in North Hampton, NH
- 16240.4%Outside Fires
- 13633.9%Structure Fires
- 7117.7%Mobile Property/Vehicle Fires
- 328.0%Other
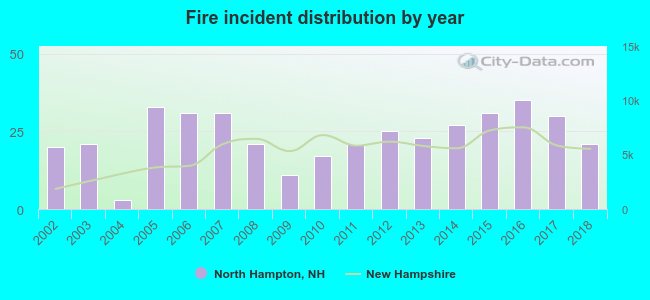 Based on the data from the years 2002 - 2018 the average number of fire incidents per year is 24. The highest number of fires - 35 took place in 2016, and the least - 3 in 2004. The data has a rising trend.
 30.9% incidents where reported in the morning and 69.1% in the evening. The most fires (16.7%) took place on Saturday, and the least (12.2%) on Sunday.
 According to the 401 fire incidents from years 2002 - 2018 most fires (12.5%) took place during July, and the least (4.5%) in February.
 Out of all 6,115 cases reported during the years 2002 - 2018, the most belonged to the categories: Rescue & EMS (48.5%), Hazardous Condition (13.7%), and Good Intent Call (13.5%).
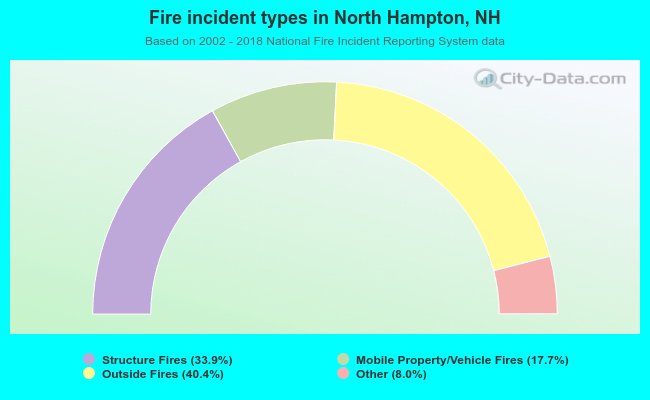 When looking into fire subcategories, the most reports belonged to: Outside Fires (40.4%), and Structure Fires (33.9%).