North Liberty: Fire Incidents, Indiana (IN)
Where are fire incidents reported in North Liberty, IN
Something went wrong! Please refresh the page.
|
| |||||||||||||||||||||||||||||||||||||||||||||||||||||||||||||||||||||||||||||||||||||||||||||||||||||||||||||
2002 - 2018 National Fire Incident Reporting System (NFIRS) incidents
- Incident types reported to NFIRS in North Liberty, IN
- 38337.3%Fire
- 22922.3%Special Incident
- 20219.6%Rescue & EMS
- 1019.8%Hazardous Condition
- 464.5%False Alarm
- 454.4%Service Call
- 151.5%Good Intent Call
- 40.4%Severe Weather
- 30.3%Overpressure Rupture
- Fire incident types reported to NFIRS in North Liberty, IN
- 13134.2%Other
- 12733.2%Outside Fires
- 10026.1%Structure Fires
- 256.5%Mobile Property/Vehicle Fires
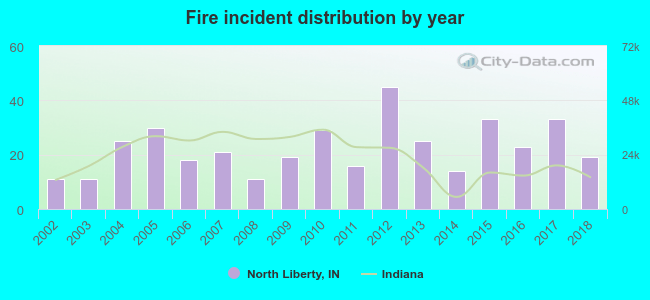 According to the data from the years 2002 - 2018 the average number of fire incidents per year is 23. The highest number of reported fire incidents - 45 took place in 2012, and the least - 11 in 2002. The data has a rising trend.
 31.6% incidents where reported in the morning and 68.4% in the evening. The most fires (17.5%) took place on Thursday, and the least (11.2%) on Monday.
 Based on the 383 fire incident reports from years 2002 - 2018 most fires (14.1%) took place during April, and the least (4.2%) in September.
 Out of all 1,028 cases reported during the years 2002 - 2018, the most belonged to the categories: Fire (37.3%), Special Incident (22.3%), and Rescue & EMS (19.6%).
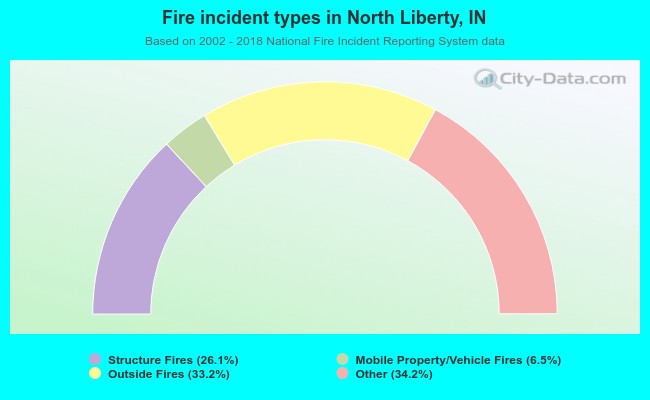 When looking into fire subcategories, the most reports belonged to: Other (34.2%), and Outside Fires (33.2%).