North Mankato: Fire Incidents, Minnesota (MN)
Where are fire incidents reported in North Mankato, MN
Something went wrong! Please refresh the page.
|
| |||||||||||||||||||||||||||||||||||||||||||||||||||||||||||||||||||||||||||||||||||||||||||||||||||||||||||||
2002 - 2018 National Fire Incident Reporting System (NFIRS) incidents
- Incident types reported to NFIRS in North Mankato, MN
- 38732.6%Fire
- 35229.7%False Alarm
- 28524.0%Hazardous Condition
- 705.9%Good Intent Call
- 665.6%Service Call
- 141.2%Rescue & EMS
- 110.9%Overpressure Rupture
- 20.2%Severe Weather
- Fire incident types reported to NFIRS in North Mankato, MN
- 18948.8%Structure Fires
- 10226.4%Outside Fires
- 8522.0%Mobile Property/Vehicle Fires
- 112.8%Other
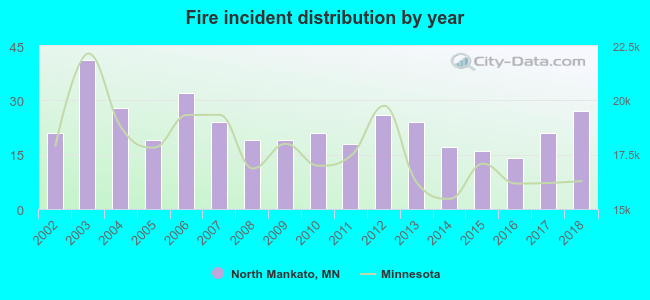 According to the data from the years 2002 - 2018 the average number of fire incidents per year is 23. The highest number of fires - 41 took place in 2003, and the least - 14 in 2016. The data has a growing trend.
The average number of yearly fire incidents per 10k residents in North Mankato, MN compared to nearest cities:
(Note: Based on data for the last 3 years, including only cities with population 5,000 and above)
| North Mankato: | 15.4 |
| Mankato: | 32.2 |
| New Ulm: | 25.4 |
| Waseca: | 41.3 |
| Belle Plaine: | 25.6 |
| New Prague: | 34.0 |
| Faribault: | 43.5 |
| Jordan: | 35.7 |
| Owatonna: | 24.8 |
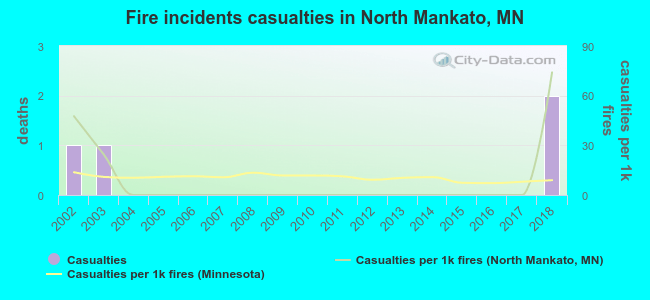 According to the data from the years 2002 - 2018 the average number of fire-related yearly casualties is 0. The highest number of reported injuries - 2 took place in 2018, and the lowest - 0 in 2004. The data has a growing trend.
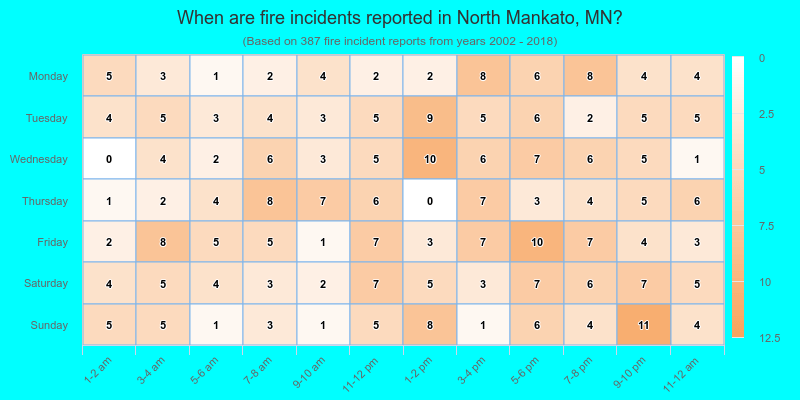
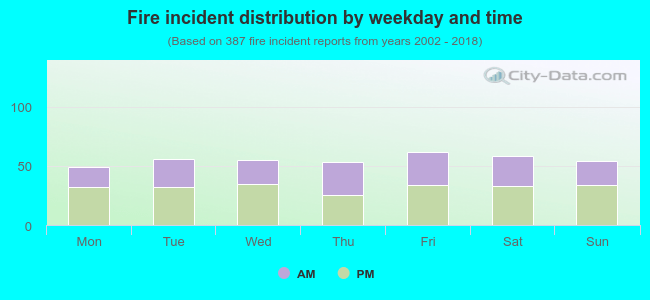 41.9% incidents where reported in the morning and 58.1% in the evening. The most fires (16.0%) took place on Friday, and the least (12.7%) on Monday.
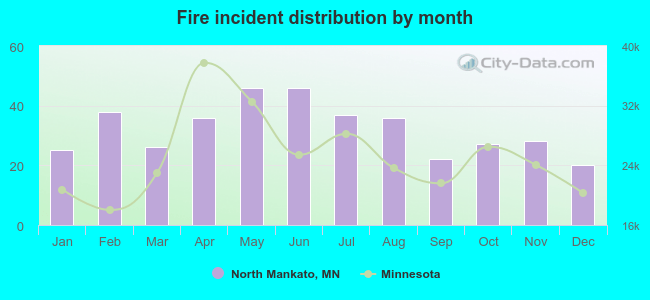 Based on the 387 fire incidents from years 2002 - 2018 most fires (11.9%) took place during May, and the least (5.2%) in December.
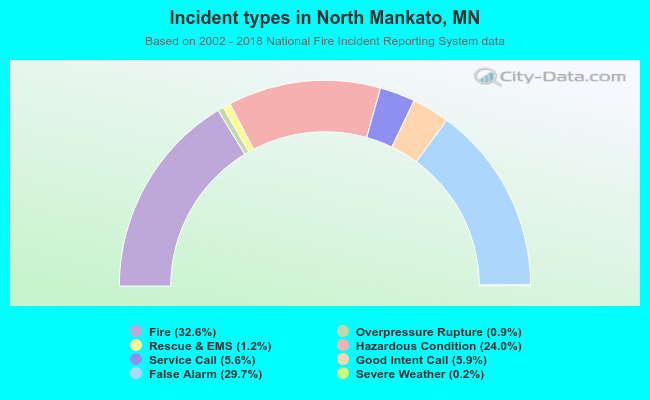 Out of all 1,187 cases reported during the years 2002 - 2018, the most belonged to the categories: Fire (32.6%), False Alarm (29.7%), and Hazardous Condition (24.0%).
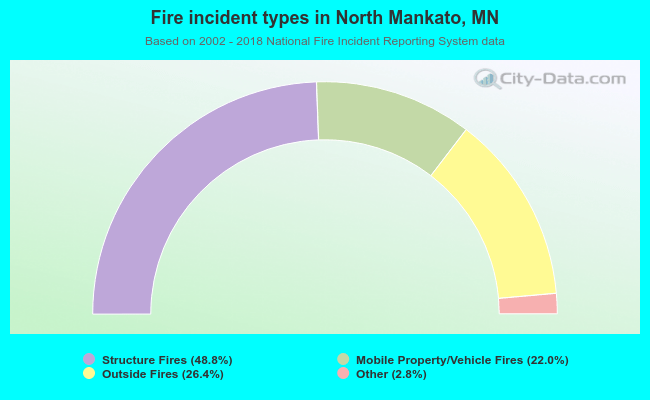 When looking into fire subcategories, the most reports belonged to: Structure Fires (48.8%), and Outside Fires (26.4%).