North Norwich: Fire Incidents, New York (NY)
Where are fire incidents reported in North Norwich, NY
Something went wrong! Please refresh the page.
|
| |||||||||||||||||||||||||||||||||||||||||||||||||||||||||||||||||||||||||||||||||||||||||||||
2002 - 2018 National Fire Incident Reporting System (NFIRS) incidents
- Incident types reported to NFIRS in North Norwich, NY
- 33457.8%Rescue & EMS
- 10818.7%Fire
- 6411.1%Hazardous Condition
- 406.9%Good Intent Call
- 162.8%False Alarm
- 142.4%Service Call
- 20.3%Special Incident
- Fire incident types reported to NFIRS in North Norwich, NY
- 6156.5%Structure Fires
- 1816.7%Outside Fires
- 1715.7%Mobile Property/Vehicle Fires
- 1211.1%Other
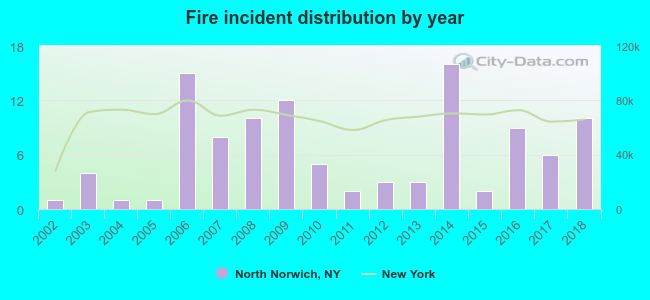 Based on the data from the years 2002 - 2018 the average number of fire incidents per year is 6. The highest number of reported fire incidents - 16 took place in 2014, and the least - 1 in 2002. The data has a growing trend.
 36.1% incidents where reported in the morning and 63.9% in the evening. The most fires (21.3%) took place on Wednesday, and the least (8.3%) on Tuesday.
 According to the 108 reports from years 2002 - 2018 most fires (14.8%) took place during April, and the least (1.9%) in May.
 Out of all 578 cases reported during the years 2002 - 2018, the most belonged to the categories: Overpressure Rupture (57.8%), Fire (18.7%), and Rescue & EMS (11.1%).
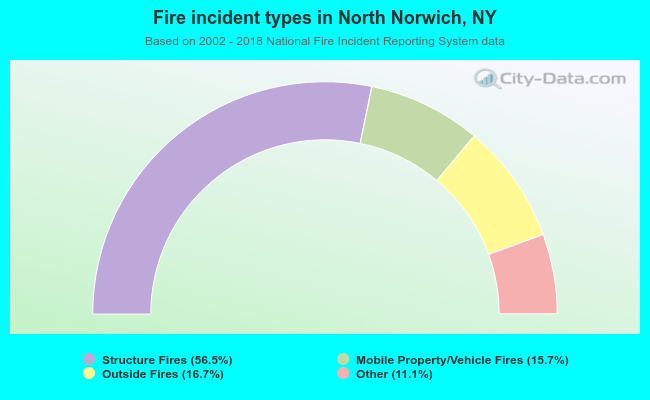 When looking into fire subcategories, the most incidents belonged to: Structure Fires (56.5%), and Outside Fires (16.7%).