North Salem: Fire Incidents, Indiana (IN)
Where are fire incidents reported in North Salem, IN
Something went wrong! Please refresh the page.
|
| |||||||||||||||||||||||||||||||||||||||||||||||||||||||||||||||||||||||||||||||||||||||||||||||||||||||||||||
2002 - 2018 National Fire Incident Reporting System (NFIRS) incidents
- Incident types reported to NFIRS in North Salem, IN
- 30344.9%Rescue & EMS
- 19528.9%Fire
- 7711.4%Good Intent Call
- 629.2%Hazardous Condition
- 152.2%Service Call
- 121.8%False Alarm
- 50.7%Special Incident
- 40.6%Overpressure Rupture
- 20.3%Severe Weather
- Fire incident types reported to NFIRS in North Salem, IN
- 14172.3%Structure Fires
- 3920.0%Outside Fires
- 94.6%Other
- 63.1%Mobile Property/Vehicle Fires
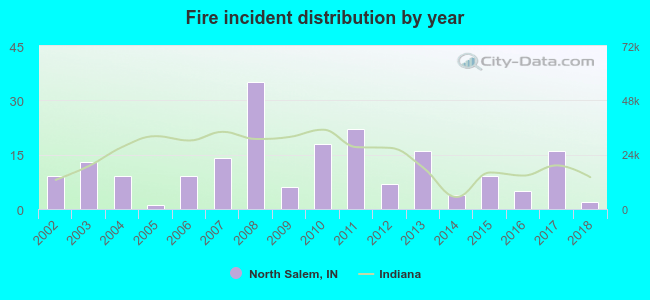 According to the data from the years 2002 - 2018 the average number of fire incidents per year is 11. The highest number of reported fire incidents - 35 took place in 2008, and the least - 1 in 2005. The data has a declining trend.
 37.4% incidents where reported in the morning and 62.6% in the evening. The most fires (23.6%) took place on Wednesday, and the least (5.1%) on Friday.
 Based on the 195 fire incident reports from years 2002 - 2018 most fires (14.4%) took place during July, and the least (0.5%) in August.
 Out of all 675 cases reported during the years 2002 - 2018, the most belonged to the categories: Rescue & EMS (44.9%), Fire (28.9%), and Good Intent Call (11.4%).
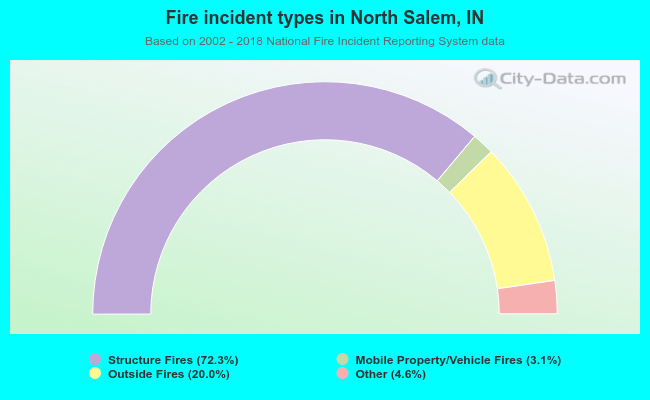 When looking into fire subcategories, the most reports belonged to: Structure Fires (72.3%), and Outside Fires (20.0%).