North Wilkesboro: Fire Incidents, North Carolina (NC)
Where are fire incidents reported in North Wilkesboro, NC
Something went wrong! Please refresh the page.
|
| |||||||||||||||||||||||||||||||||||||||||||||||||||||||||||||||||||||||||||||||||||||||||||||||||||||||||||||
| Other | 328 | |||||||||||||||||||||||||||||||||||||||||||||||||||||||||||||||||||||||||||||||||||||||||||||||||||||||||||||
2004 - 2018 National Fire Incident Reporting System (NFIRS) incidents
- Incident types reported to NFIRS in North Wilkesboro, NC
- 3,13459.5%Rescue & EMS
- 91017.3%Fire
- 4218.0%Hazardous Condition
- 3727.1%False Alarm
- 2184.1%Good Intent Call
- 1663.2%Service Call
- 260.5%Special Incident
- 200.4%Severe Weather
- Fire incident types reported to NFIRS in North Wilkesboro, NC
- 48753.5%Structure Fires
- 23525.8%Outside Fires
- 9910.9%Mobile Property/Vehicle Fires
- 899.8%Other
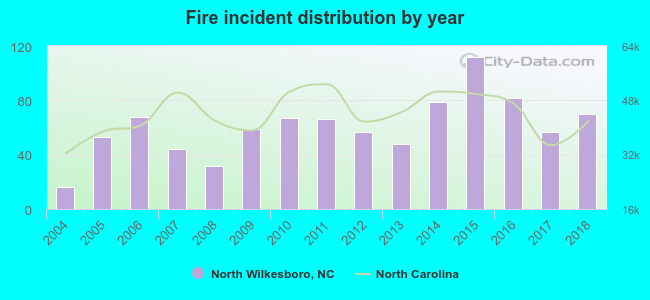 Based on the data from the years 2004 - 2018 the average number of fire incidents per year is 61. The highest number of reported fires - 112 took place in 2015, and the least - 16 in 2004. The data has a growing trend.
 The median response time based on all reported fire incidents is 6 minutes. This is similar to the state median value.
The median response time in North Wilkesboro, NC compared to nearest cities:
(Note: Based on data for all years, including only cities with at least 500 fire incidents)
| North Wilkesboro: | 6 minutes |
| Wilkesboro: | 8 minutes |
| Millers Creek: | 9 minutes |
| Elkin: | 8 minutes |
| Jonesville: | 9 minutes |
| Taylorsville: | 6 minutes |
| Boonville: | 9 minutes |
| Harmony: | 7 minutes |
| Yadkinville: | 8 minutes |
 Based on the reports from the years 2004 - 2018 the average number of fire-related fatalities per year is 0. The highest number of deaths - 1 took place in 2013, and the lowest - 0 in 2004. The data has a constant trend.
 30.8% incidents where reported in the morning and 69.2% in the evening. The most fires (17.1%) took place on Saturday, and the least (12.6%) on Sunday.
 According to the 910 fire incidents from years 2004 - 2018 most fires (12.4%) took place during November, and the least (5.3%) in June.
 Out of all 5,269 cases reported during the years 2004 - 2018, the most belonged to the categories: Rescue & EMS (59.5%), Fire (17.3%), and Hazardous Condition (8.0%).
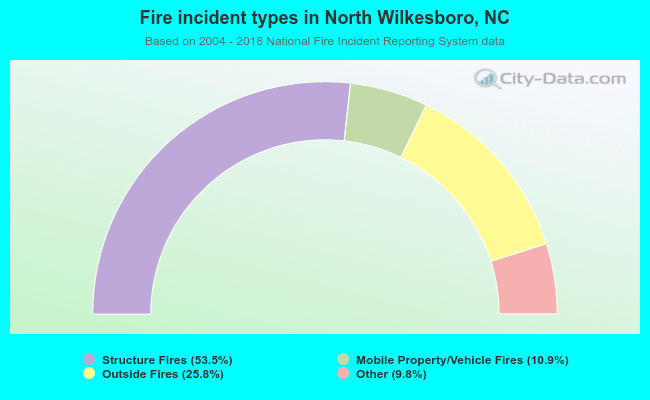 When looking into fire subcategories, the most incidents belonged to: Structure Fires (53.5%), and Outside Fires (25.8%).