Northern Cambria: Fire Incidents, Pennsylvania (PA)
Where are fire incidents reported in Northern Cambria, PA
Something went wrong! Please refresh the page.
|
| |||||||||||||||||||||||||||||||||||||||||||||||||||||||||||||||||||||||||||||||||||||||||||||||||||||||||||||
2004 - 2018 National Fire Incident Reporting System (NFIRS) incidents
- Incident types reported to NFIRS in Northern Cambria, PA
- 17123.0%Rescue & EMS
- 16822.6%Fire
- 14319.3%Hazardous Condition
- 11615.6%Service Call
- 547.3%Good Intent Call
- 527.0%False Alarm
- 324.3%Severe Weather
- 60.8%Special Incident
- Fire incident types reported to NFIRS in Northern Cambria, PA
- 10964.9%Structure Fires
- 3118.5%Outside Fires
- 2112.5%Mobile Property/Vehicle Fires
- 74.2%Other
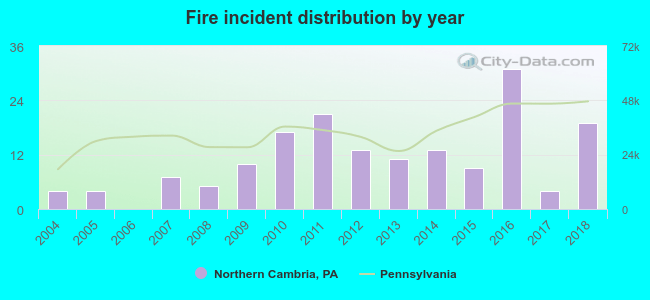 According to the data from the years 2004 - 2018 the average number of fires per year is 11. The highest number of reported fire incidents - 31 took place in 2016, and the least - 0 in 2006. The data has an increasing trend.
 32.7% incidents where reported in the morning and 67.3% in the evening. The most fires (17.9%) took place on Thursday, and the least (11.3%) on Monday.
 According to the 168 incident reports from years 2004 - 2018 most fires (14.3%) took place during May, and the least (4.2%) in June.
 Out of all 742 cases reported during the years 2004 - 2018, the most belonged to the categories: Overpressure Rupture (23.0%), Fire (22.6%), and Rescue & EMS (19.3%).
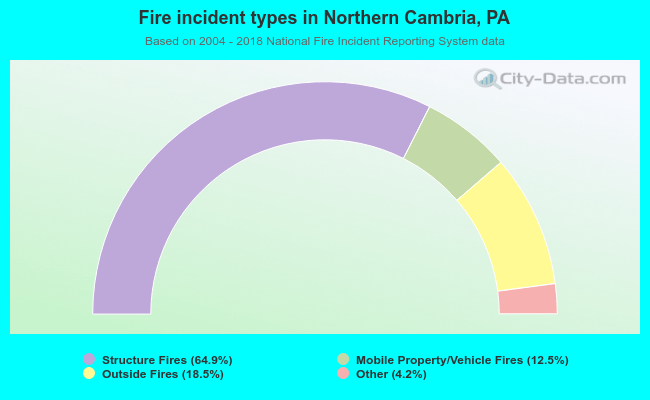 When looking into fire subcategories, the most incidents belonged to: Structure Fires (64.9%), and Outside Fires (18.5%).