| Fire incidents reported |
|---|
| Sreet name | Count |
|---|
| MAIN ST | 30 | | CALDWELL RD | 14 | | MILLERS FALLS RD | 14 | | FOUR MILE BROOK RD | 12 | | MT HERMON STATION RD | 12 | | MT. HERMON STATION RD | 12 | | SOUTH MOUNTAIN RD | 12 | | SOUTH MOUNTIAN RD | 12 | | WINCHESTER RD | 10 | | MAPLE ST | 8 | | WANAMAKER RD | 8 | | WARWICK RD | 8 | | GULF RD | 6 | | HOLLY AVE | 6 | | OLD WENDELL RD | 6 | | SCHOOL ST | 6 | | BIRNAM RD | 4 | | JEWETT RD | 4 | | LYMAN RD | 4 | | MILLERS FALLS ROAD | 4 | | MOUNT HERMAN STATION RD | 4 | | MOUNT HERMON STATION RD | 4 | | MOUNT HERMON STATION ROAD | 4 | | MOUNTAIN RD | 4 | | OLD VERNON RD | 4 |
| | | Fire incidents reported |
|---|
| Sreet name | Count |
|---|
| PINE MEADOW RD | 4 | | PINE ST | 4 | | RIVER RD | 4 | | WEST NORTHFIELD RD | 4 | | ADAMS RD | 2 | | BENNETT BROOK RD | 2 | | BIRMAN RD | 2 | | BIRNHAM RD | 2 | | CALDWELL RD | 2 | | CAPTIAN BEERS PLAIN RD | 2 | | DICKINSON ST | 2 | | EAST STREET | 2 | | FERNCLIFF CIR | 2 | | FISHER RD | 2 | | HIGHLAND | 2 | | HIGHLAND AVE | 2 | | HINSDALE RD. | 2 | | HOLTON ST | 2 | | HOMER RD | 2 | | JEWWETT RD | 2 | | LUCKY CLAPP RD | 2 | | MAIN STREET | 2 | | MANNING HL | 2 | | MILLERFALLS RD | 2 | | MT HERMAN STATION RD | 2 |
|
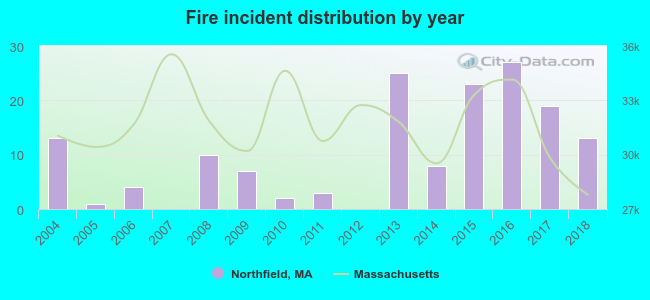 According to the data from the years 2004 - 2018 the average number of fires per year is 10. The highest number of reported fires - 27 took place in 2016, and the least - 0 in 2007. The data has a constant trend.
 29.7% incidents where reported in the morning and 70.3% in the evening. The most fires (20.0%) took place on Sunday, and the least (6.5%) on Wednesday.
 Based on the 155 fire incident reports from years 2004 - 2018 most fires (21.3%) took place during April, and the least (1.9%) in October.
 Out of all 682 cases reported during the years 2004 - 2018, the most belonged to the categories: Hazardous Condition (28.3%), Fire (22.7%), and False Alarm (21.3%).
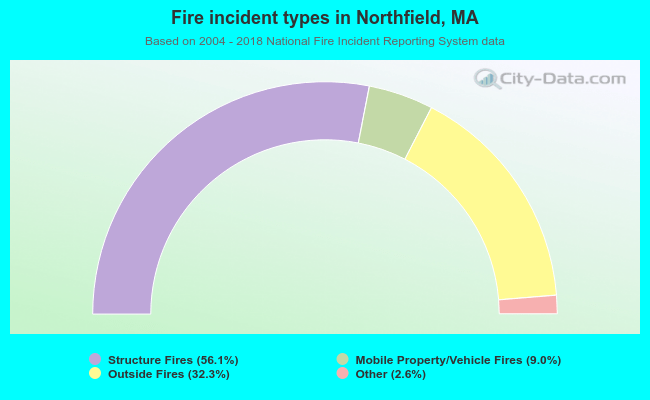 When looking into fire subcategories, the most reports belonged to: Structure Fires (56.1%), and Outside Fires (32.3%).