Northvale: Fire Incidents, New Jersey (NJ)
Where are fire incidents reported in Northvale, NJ
Something went wrong! Please refresh the page.
|
| |||||||||||||||||||||||||||||||||||||||||||||||||||||||||||||||||||||||||||||||||||||||||||||||||||||||||||||
2004 - 2018 National Fire Incident Reporting System (NFIRS) incidents
- Incident types reported to NFIRS in Northvale, NJ
- 29835.1%Hazardous Condition
- 28934.0%False Alarm
- 15618.4%Fire
- 586.8%Good Intent Call
- 283.3%Service Call
- 101.2%Overpressure Rupture
- 70.8%Rescue & EMS
- 20.2%Special Incident
- 10.1%Severe Weather
- Fire incident types reported to NFIRS in Northvale, NJ
- 8252.6%Structure Fires
- 5434.6%Outside Fires
- 138.3%Other
- 74.5%Mobile Property/Vehicle Fires
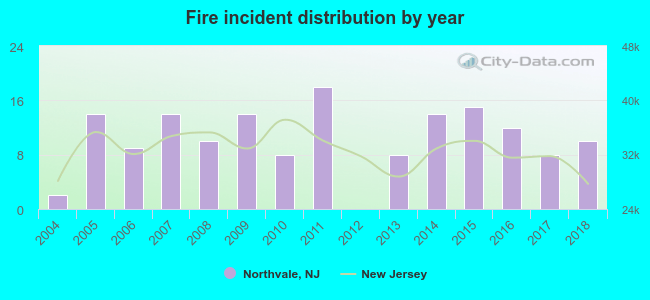 Based on the data from the years 2004 - 2018 the average number of fires per year is 10. The highest number of reported fire incidents - 18 took place in 2011, and the least - 0 in 2012. The data has a rising trend.
 33.3% incidents where reported in the morning and 66.7% in the evening. The most fires (19.9%) took place on Monday, and the least (12.2%) on Wednesday.
 Based on the 156 fire incidents from years 2004 - 2018 most fires (13.5%) took place during March, and the least (3.2%) in January.
 Out of all 849 cases reported during the years 2004 - 2018, the most belonged to the categories: Hazardous Condition (35.1%), False Alarm (34.0%), and Fire (18.4%).
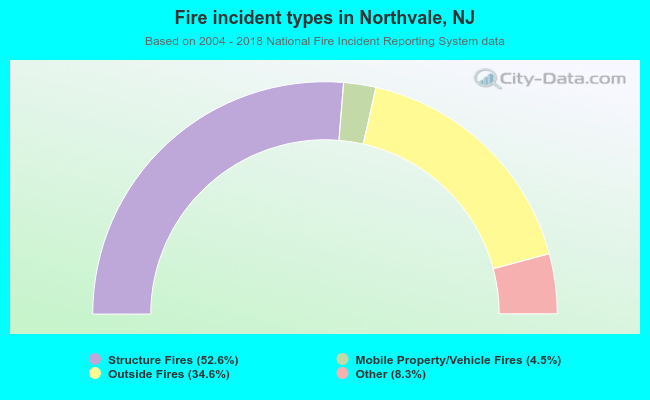 When looking into fire subcategories, the most incidents belonged to: Structure Fires (52.6%), and Outside Fires (34.6%).