| Fire incidents reported |
|---|
| Sreet name | Count |
|---|
| 2724 5TH AVE | 6 | | 36TH ST AND 1ST AVE | 6 | | HIGHWAY 18 | 6 | | 37TH ST NE3RD AVE | 4 | | 3804 10TH AVE NE AVE | 4 | | 854 36TH ST NE | 4 | | 1 N 1 E OF CTY 2 | 2 | | 1 N DOHENY ST | 2 | | 1 SO. COUNTY 6 ,1 EA | 2 | | 101 HIGHWAY 15 | 2 | | 101 US HIGHWAY 15 HWY | 2 | | 105 BERG ST | 2 | | 1051 48TH ST. | 2 | | 11 30TH ST NE | 2 | | 112 3RD AVE. | 2 | | 1149 26TH ST NE | 2 | | 1190 35TH ST | 2 | | 11MI W 12MI N OF HWY15 | 2 | | 12 M N OF 5TH AV 29TH ST NE | 2 | | 12 MI N OF SUNRISE ACRES | 2 | | 12 MILES WEST ON HWY 18 | 2 | | 1293 41ST NE | 2 | | 14 MILE N OF 31ST ST NE 5TH | 2 | | 178 32ND ST NE | 2 | | 1MI N OF 5TH AVE 29TH ST NE | 2 |
| | | Fire incidents reported |
|---|
| Sreet name | Count |
|---|
| 204 S ADAM ST | 2 | | 211 S. RAYMOND | 2 | | 212 RAYMOND ST. | 2 | | 22ND ST 3RD AVE. | 2 | | 2340 5TH AVE NE | 2 | | 256 36 ST | 2 | | 2914 7TH AVE NE | 2 | | 2950 11TH AVE | 2 | | 2965 4TH AVE | 2 | | 2EAST&3.5SOUTH OF 15 | 2 | | 308 4TH. AVE | 2 | | 3122 1ST AVE NE | 2 | | 31ST ST NE9TH AVE | 2 | | 3250 11 AVE. N. | 2 | | 32ST NE CORNER OF 5THAVE | 2 | | 3306 5TH AVE NE | 2 | | 3332 1ST AVE | 2 | | 33ST 10AVE. | 2 | | 34 ST | 2 | | 3445 2ND AVE NE | 2 | | 3500 AIRPORT RD 35TH ST NE | 2 | | 3535 5TH AVE NE | 2 | | 3597 3AVE. N.E. | 2 | | 3636 5TH AVE NE | 2 | | |
|
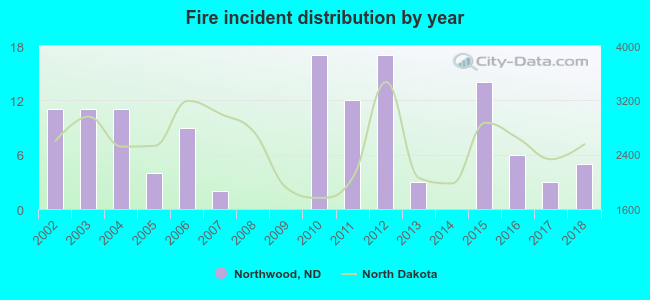 According to the data from the years 2002 - 2018 the average number of fires per year is 7. The highest number of reported fire incidents - 17 took place in 2010, and the least - 0 in 2008. The data has a decreasing trend.
 30.4% incidents where reported in the morning and 69.6% in the evening. The most fires (19.2%) took place on Monday, and the least (10.4%) on Tuesday.
 According to the 125 fire incidents from years 2002 - 2018 most fires (20.0%) took place during April, and the least (4.8%) in February.
 Out of all 171 cases reported during the years 2002 - 2018, the most belonged to the categories: Fire (73.1%), Rescue & EMS (12.3%), and Hazardous Condition (8.2%).
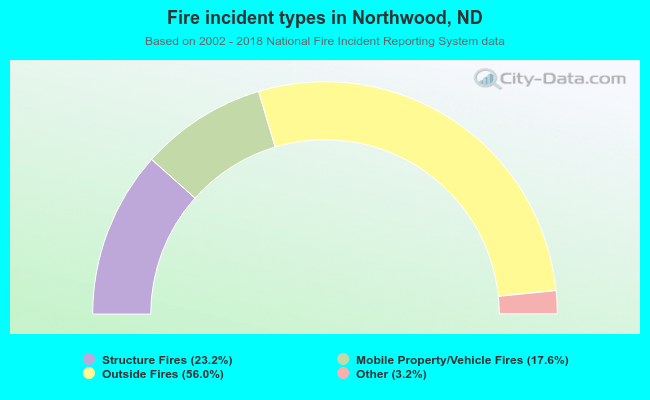 When looking into fire subcategories, the most reports belonged to: Outside Fires (56.0%), and Structure Fires (23.2%).