Norwalk: Fire Incidents, Ohio (OH)
Where are fire incidents reported in Norwalk, OH
Something went wrong! Please refresh the page.
| Fire incidents reported | |
|---|---|
| Sreet name | Count |
| MILAN AVE | 146 |
| MAIN ST | 136 |
| OLD STATE RD | 94 |
| WHITTLESEY AVE | 72 |
| U S RT 250 RT | 66 |
| BENEDICT AVE | 58 |
| INDUSTRIAL PKY | 58 |
| STATE RT 61 RT | 50 |
| WEST ST | 46 |
| STATE RT 601 RT | 44 |
| PLEASANT ST | 40 |
| WOODLAWN AVE | 40 |
| REPUBLIC ST | 38 |
| CLEVELAND RD | 34 |
| PERU OLENA RD | 34 |
| STATE ST | 32 |
| NEW STATE RD | 28 |
| PLANK RD | 28 |
| LAYLIN RD | 26 |
| U S RT 20 RT | 26 |
| WASHINGTON ST | 26 |
| FOSTER ST | 24 |
| JEFFERSON ST | 24 |
| LEAGUE ST | 24 |
| LINWOOD AVE | 24 |
| SHADY LANE DR | 24 |
| GRAND AVE | 22 |
| NEWTON ST | 22 |
| PARSONS ST | 22 |
| RIDGE RD | 22 |
2002 - 2018 National Fire Incident Reporting System (NFIRS) incidents
- Incident types reported to NFIRS in Norwalk, OH
- 5,55452.1%Rescue & EMS
- 1,83417.2%Hazardous Condition
- 1,31012.3%Fire
- 9528.9%Service Call
- 5725.4%False Alarm
- 3683.5%Good Intent Call
- 300.3%Special Incident
- 230.2%Overpressure Rupture
- 210.2%Severe Weather
- Fire incident types reported to NFIRS in Norwalk, OH
- 61647.0%Structure Fires
- 50738.7%Outside Fires
- 18714.3%Mobile Property/Vehicle Fires
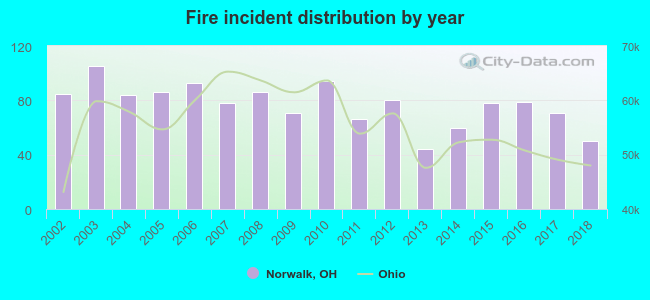 According to the data from the years 2002 - 2018 the average number of fire incidents per year is 77. The highest number of reported fire incidents - 105 took place in 2003, and the least - 44 in 2013. The data has a decreasing trend.
The average number of yearly fire incidents per 10k residents in Norwalk, OH compared to nearest cities:
(Note: Based on data for the last 3 years, including only cities with population 5,000 and above)
| Norwalk: | 39.5 |
| Huron: | 36.4 |
| Bellevue: | 67.8 |
| Willard: | 78.2 |
| Sandusky: | 81.4 |
| Vermilion: | 48.4 |
| Clyde: | 56.5 |
| Oberlin: | 58.6 |
| Amherst: | 59.8 |
 The median response time based on all reported fire incidents is 4 minutes. This is lower than the Ohio median value.
The median response time in Norwalk, OH compared to nearest cities:
(Note: Based on data for all years, including only cities with at least 500 fire incidents)
| Norwalk: | 4 minutes |
| Huron: | 6 minutes |
| Bellevue: | 6 minutes |
| Willard: | 7 minutes |
| Sandusky: | 4 minutes |
| Vermilion: | 8 minutes |
| Clyde: | 6 minutes |
| Oberlin: | 6 minutes |
| Wellington: | 8 minutes |
 According to the reports from the years 2002 - 2018 the average number of fire-related fatalities per year is 0. The highest number of reported deaths - 3 took place in 2018, and the lowest - 0 in 2002. The data has a rising trend.
 According to the data from the years 2002 - 2018 the average number of fire-related casualties per year is 1. The highest number of injuries - 3 took place in 2003, and the lowest - 0 in 2004. The data has a constant trend.
The average number of injuries per 1,000 fire incidents is 13. This indicator was the highest - 35 in 2005, and the lowest 0 in 2004. The trend for injuries per 1,000 fire incidents is increasing. Compared to the Ohio value the number of injuries per 1,000 fire incidents is similar.
According to the data from the years 2002 - 2018 the average number of fire-related casualties per year is 1. The highest number of injuries - 3 took place in 2003, and the lowest - 0 in 2004. The data has a constant trend.
The average number of injuries per 1,000 fire incidents is 13. This indicator was the highest - 35 in 2005, and the lowest 0 in 2004. The trend for injuries per 1,000 fire incidents is increasing. Compared to the Ohio value the number of injuries per 1,000 fire incidents is similar.
 32.6% incidents where reported in the morning and 67.4% in the evening. The most fires (17.0%) took place on Saturday, and the least (11.7%) on Friday.
 Based on the 1,310 fire incident reports from years 2002 - 2018 most fires (11.1%) took place during April, and the least (5.0%) in December.
 Out of all 10,664 cases reported during the years 2002 - 2018, the most belonged to the categories: Rescue & EMS (52.1%), Hazardous Condition (17.2%), and Fire (12.3%).
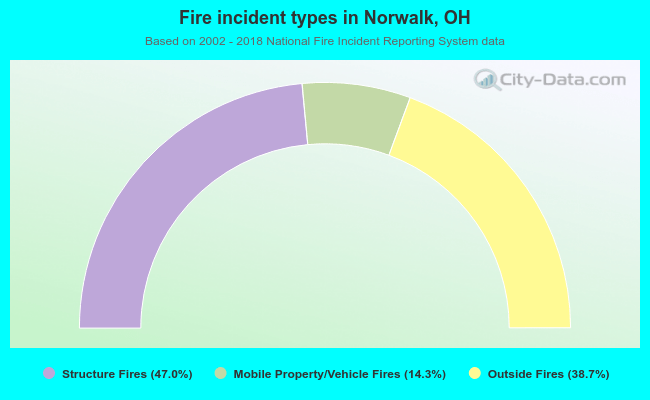 When looking into fire subcategories, the most incidents belonged to: Structure Fires (47.0%), and Outside Fires (38.7%).