Novi: Fire Incidents, Michigan (MI)
Where are fire incidents reported in Novi, MI
Something went wrong! Please refresh the page.
| Fire incidents reported | |
|---|---|
| Sreet name | Count |
| GRAND RIVER AVE | 232 |
| NOVI RD | 204 |
| HAGGERTY RD | 108 |
| TWELVE MILE RD | 92 |
| TEN MILE RD | 90 |
| NINE MILE RD | 66 |
| ELEVEN MILE RD | 62 |
| MEADOWBROOK RD | 60 |
| MAIN ST | 58 |
| BECK RD | 56 |
| THIRTEEN MILE RD | 48 |
| I-96 | 42 |
| CRESCENT BLVD | 38 |
| WEST OAKS DR | 38 |
| GLEN HAVEN CIR | 30 |
| I96 OFRP | 28 |
| EAST LAKE RD | 24 |
| EIGHT MILE RD | 24 |
| WELLINGTON DR | 24 |
| WOODLAND GLEN DR | 24 |
| HURON CIR | 22 |
| M-5 | 22 |
| MONTMORENCY | 22 |
| SOLOMON BLVD | 22 |
| WEST LAKE DR | 22 |
| BEACHWALK DR | 20 |
| FOURTEEN MILE RD | 20 |
| M5 COLL | 20 |
| TAFT RD | 20 |
| LAKEVIEW CT | 18 |
| Other | 214 |
2002 - 2018 National Fire Incident Reporting System (NFIRS) incidents
- Incident types reported to NFIRS in Novi, MI
- 20,05452.5%Rescue & EMS
- 6,10416.0%Special Incident
- 3,0958.1%Service Call
- 2,6296.9%False Alarm
- 2,6116.8%Hazardous Condition
- 1,7704.6%Fire
- 1,7194.5%Good Intent Call
- 1730.5%Severe Weather
- Fire incident types reported to NFIRS in Novi, MI
- 76643.3%Structure Fires
- 53630.3%Outside Fires
- 44024.9%Mobile Property/Vehicle Fires
- 281.6%Other
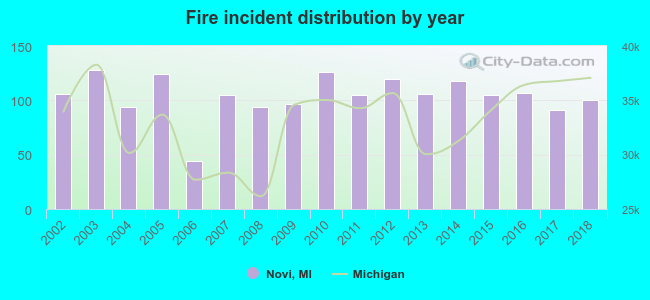 Based on the data from the years 2002 - 2018 the average number of fires per year is 104. The highest number of fire incidents - 128 took place in 2003, and the least - 44 in 2006. The data has a decreasing trend.
The average number of yearly fire incidents per 10k residents in Novi, MI compared to nearest cities:
(Note: Based on data for the last 3 years, including only cities with population 5,000 and above)
| Novi: | 17.0 |
| Northville: | 96.4 |
| Walled Lake: | 32.3 |
| Wixom: | 23.8 |
| Farmington Hills: | 15.0 |
| Farmington: | 18.3 |
| Plymouth: | 102.2 |
| Plymouth Township: | 2.4 |
| Livonia: | 14.2 |
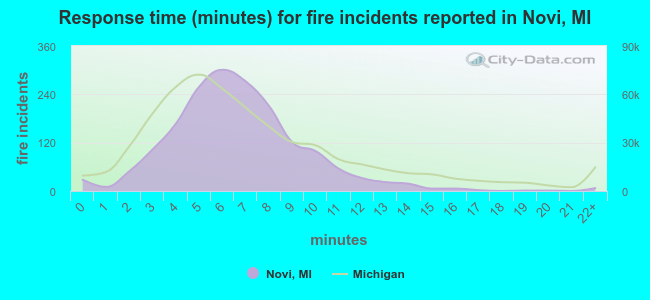 The median response time based on all reported fire incidents is 6 minutes. This is about the same as the state median value.
The median response time in Novi, MI compared to nearest cities:
(Note: Based on data for all years, including only cities with at least 500 fire incidents)
| Novi: | 6 minutes |
| Northville: | 7 minutes |
| Wixom: | 9 minutes |
| Farmington Hills: | 8 minutes |
| Plymouth: | 6 minutes |
| Livonia: | 4 minutes |
| South Lyon: | 7 minutes |
| Canton: | 6 minutes |
| Southfield: | 5 minutes |
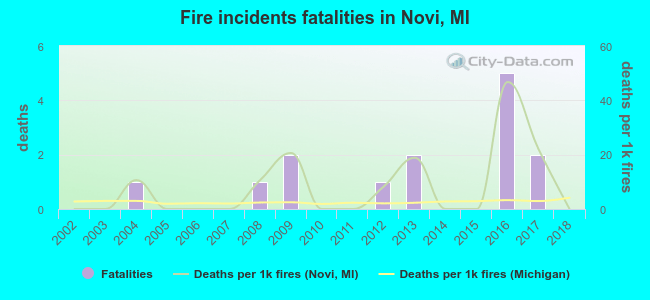 According to the reports from the years 2002 - 2018 the average number of fire-related fatalities per year is 1. The highest number of deaths - 5 took place in 2016, and the lowest - 0 in 2002. The data has a constant trend.
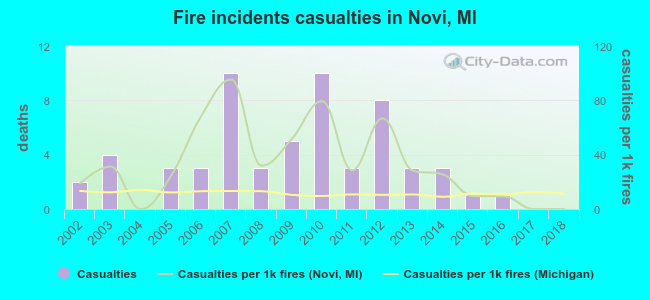 According to the data from the years 2002 - 2018 the average number of fire-related casualties per year is 3. The highest number of reported injuries - 10 took place in 2007, and the lowest - 0 in 2004. The data has a decreasing trend.
The average number of casualties per 1,000 fire incidents is 33. This indicator was the highest - 95 in 2007, and the lowest 0 in 2004. The trend for casualties per 1,000 fires is dropping. Compared to the Michigan value the number of injuries per 1,000 fires is much higher.
According to the data from the years 2002 - 2018 the average number of fire-related casualties per year is 3. The highest number of reported injuries - 10 took place in 2007, and the lowest - 0 in 2004. The data has a decreasing trend.
The average number of casualties per 1,000 fire incidents is 33. This indicator was the highest - 95 in 2007, and the lowest 0 in 2004. The trend for casualties per 1,000 fires is dropping. Compared to the Michigan value the number of injuries per 1,000 fires is much higher.Casualties per 1,000 incidents in Novi, MI compared to nearest cities:
(Note: Based on data for all years, including only cities with at least 500 fire incidents)
| Novi: | 33.3 |
| Northville: | 16.0 |
| Wixom: | 1.9 |
| Farmington Hills: | 48.2 |
| Plymouth: | 9.3 |
| Livonia: | 13.8 |
| South Lyon: | 7.6 |
| Canton: | 24.2 |
| Southfield: | 14.3 |
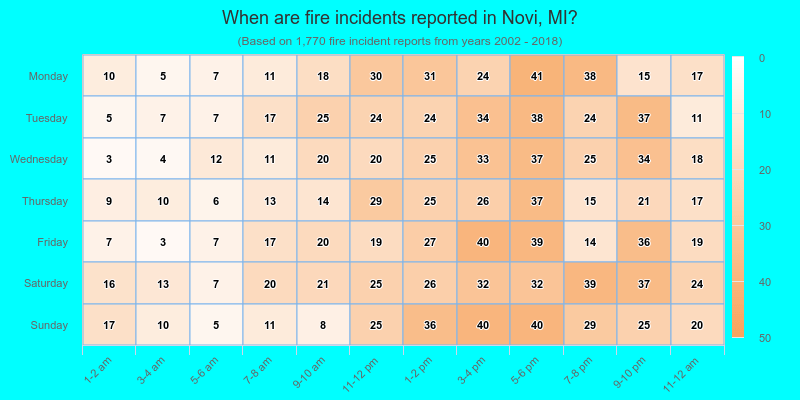
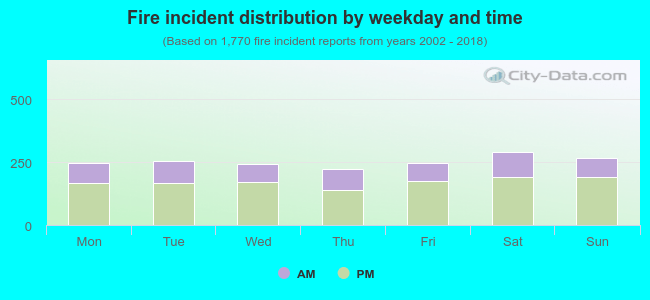 32.1% incidents where reported in the morning and 67.9% in the evening. The most fires (16.5%) took place on Saturday, and the least (12.5%) on Thursday.
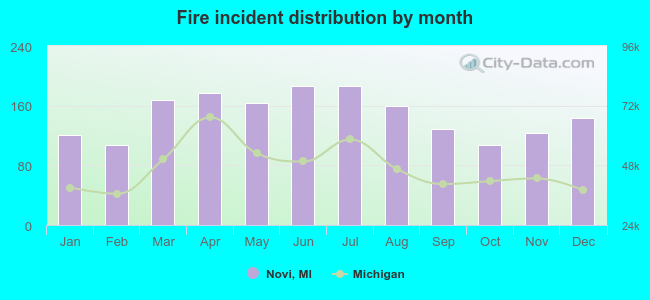 Based on the 1,770 incident reports from years 2002 - 2018 most fires (10.6%) took place during July, and the least (6.0%) in February.
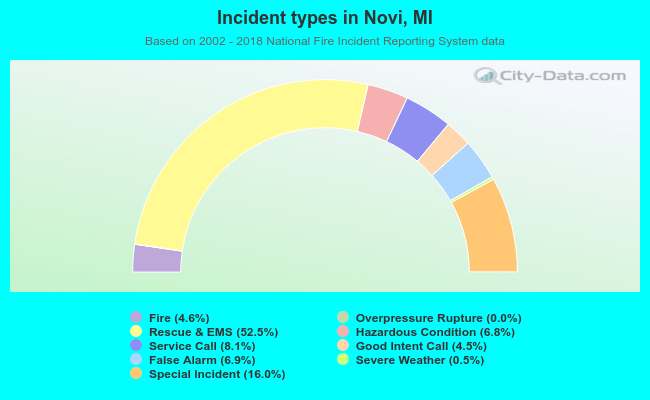 Out of all 38,165 cases reported during the years 2002 - 2018, the most belonged to the categories: Rescue & EMS (52.5%), Special Incident (16.0%), and Service Call (8.1%).
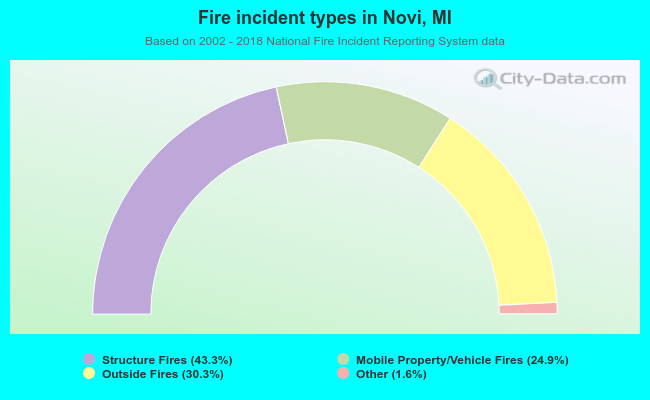 When looking into fire subcategories, the most reports belonged to: Structure Fires (43.3%), and Outside Fires (30.3%).