| Fire incidents reported |
|---|
| Sreet name | Count |
|---|
| MAIN ST | 56 | | SILVER RD | 42 | | HAZARD RD | 40 | | NC 205 HWY | 28 | | ROCKY RIVER RD | 28 | | PINE ST | 26 | | BUSTER RD | 22 | | HATLEY RD | 22 | | BIG LICK RD | 20 | | BARBEES GROVE RD | 18 | | OAK RIDGE RD | 18 | | RED CROSS RD | 18 | | ST MARTIN RD | 18 | | SWIFT RD | 18 | | EIGHTH ST | 14 | | FIRST ST | 14 | | HILL FORD RD | 14 | | LIBERTY HILL CH RD RD | 14 | | OLD SANDBAR RD | 14 | | RICHARD SANDY RD | 14 | | RIDGECREST RD | 14 | | MISTY LN | 12 | | NC 24/27 HWY | 12 | | AUSTIN RD | 10 | | ELEVENTH ST | 10 |
| | | Fire incidents reported |
|---|
| Sreet name | Count |
|---|
| FROG POND RD | 10 | | GRIFFIN-GREENE BLVD | 10 | | MCLESTER RD | 10 | | NC 138 HWY | 10 | | PEACHTREE RD | 10 | | TENTH ST | 10 | | BRANCH RD | 8 | | EIGTH ST | 8 | | FAITH ST | 8 | | GRIFFINGREENE BLVD | 8 | | LAKEWOOD RD | 8 | | NICHOLAS DR | 8 | | NINTH ST | 8 | | OAKGROVE RD | 8 | | 11TH ST | 6 | | ALONZO RD | 6 | | BOOGER HOLLAR RD | 6 | | HARRIS RD | 6 | | HATLEY BURRIS RD | 6 | | NC 2427 HWY | 6 | | OLD FARM RD | 6 | | PECAN DR | 6 | | PHILADELPHIA CHURCH RD | 6 | | PHILADELPIA CHURCH RD | 6 | | SECOND ST | 6 |
|
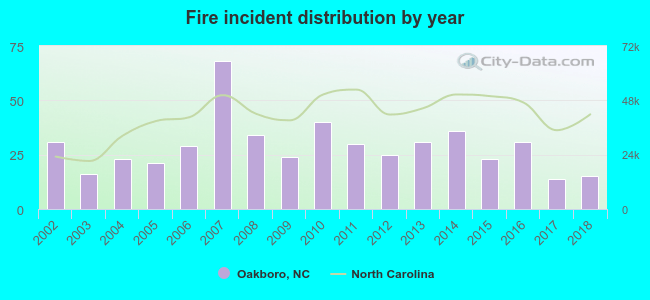 According to the data from the years 2002 - 2018 the average number of fires per year is 29. The highest number of fire incidents - 68 took place in 2007, and the least - 14 in 2017. The data has a decreasing trend.
 31.6% incidents where reported in the morning and 68.4% in the evening. The most fires (18.1%) took place on Saturday, and the least (10.6%) on Tuesday.
 According to the 491 incident reports from years 2002 - 2018 most fires (12.8%) took place during November, and the least (4.3%) in August.
 Out of all 2,471 cases reported during the years 2002 - 2018, the most belonged to the categories: Rescue & EMS (47.7%), Fire (19.9%), and Good Intent Call (13.7%).
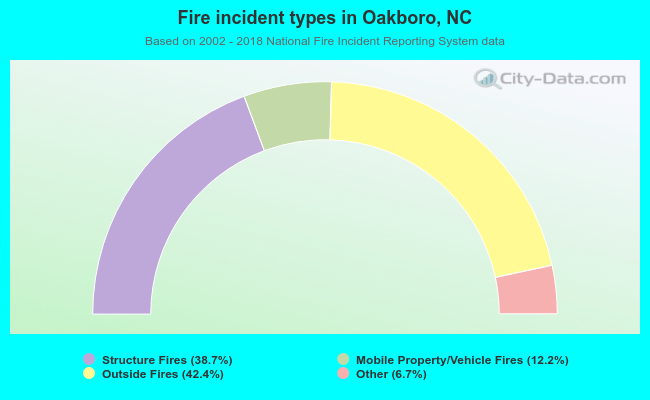 When looking into fire subcategories, the most reports belonged to: Outside Fires (42.4%), and Structure Fires (38.7%).