| Fire incidents reported |
|---|
| Sreet name | Count |
|---|
| FM 946 | 16 | | 946 HWY | 12 | | 190 HWY | 8 | | HWY ST | 6 | | WILLOW SPRINGS RD. | 6 | | 44 LONGLEY LANE | 4 | | 946 | 4 | | 946 NORTH HWY | 4 | | COUNTS RD | 4 | | ELM ST | 4 | | FM 3018 | 4 | | FM 946 SOUTH | 4 | | FM946 | 4 | | FM946 HWY | 4 | | HARRISON RD | 4 | | HWY 190 | 4 | | HWY. 190 | 4 | | HWY. 946 NORTH | 4 | | LONE OAK | 4 | | MCBRIDE | 4 | | OLD STALEY RD | 4 | | RAVEN HILL RD | 4 | | TANGLEWOOD SUBD | 4 | | 100 PIERCE RD | 2 | | 101 PECAN LANE | 2 |
| | | Fire incidents reported |
|---|
| Sreet name | Count |
|---|
| 1111 MCBRIDE LANE | 2 | | 1402 WINFREY ROAD | 2 | | 150 HOLL STREET | 2 | | 1501 946 N. | 2 | | 1502 JENKINS ROAD | 2 | | 1502 RAVEN HILL | 2 | | 1516 HWY. 946 N. | 2 | | 1600 WINFREY ROAD | 2 | | 1641 FM 980 NORTH | 2 | | 190 @ COUNTY LINE WALKER HWY | 2 | | 190 @ WATERWOOD PKWAY HWY | 2 | | 190 JUST EAST OF FM 946 HWY | 2 | | 224 @ OLD 224 | 2 | | 238 PINE TRAIL | 2 | | 304 WYATT LANE | 2 | | 3751 OLD STALEY ROAD W | 2 | | 4 MI N. ON WATERWOOD PARKWAY | 2 | | 401 CURRIE ROAD | 2 | | 500 F.M. 3018 | 2 | | 60 FM 946 SOUTH HWY | 2 | | 85 WEBB ROAD | 2 | | 946 3MI. N.OF HWY.156 | 2 | | 946 FM 946 SOUTH | 2 | | 946 NORTH | 2 | | |
|
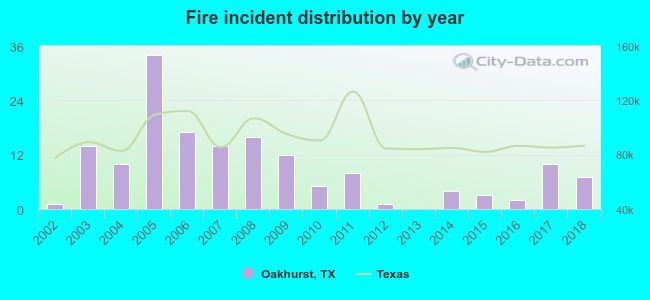 According to the data from the years 2002 - 2018 the average number of fires per year is 9. The highest number of reported fires - 34 took place in 2005, and the least - 0 in 2013. The data has a growing trend.
 32.3% incidents where reported in the morning and 67.7% in the evening. The most fires (21.5%) took place on Saturday, and the least (9.5%) on Friday.
 Based on the 158 fire incidents from years 2002 - 2018 most fires (12.7%) took place during January, and the least (5.7%) in November.
 Out of all 221 cases reported during the years 2002 - 2018, the most belonged to the categories: Fire (71.5%), Rescue & EMS (15.8%), and Overpressure Rupture (4.5%).
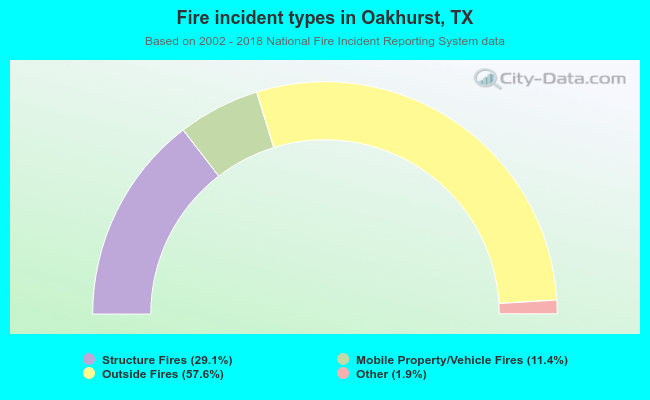 When looking into fire subcategories, the most reports belonged to: Outside Fires (57.6%), and Structure Fires (29.1%).