Oakley: Fire Incidents, Kansas (KS)
Where are fire incidents reported in Oakley, KS
Something went wrong! Please refresh the page.
|
| |||||||||||||||||||||||||||||||||||||||||||||||||||||||||||||||||||||||||||||||||||||||||||||||||
| Other | 45 | |||||||||||||||||||||||||||||||||||||||||||||||||||||||||||||||||||||||||||||||||||||||||||||||||
2002 - 2018 National Fire Incident Reporting System (NFIRS) incidents
- Incident types reported to NFIRS in Oakley, KS
- 16752.2%Fire
- 7623.8%Hazardous Condition
- 5818.1%Rescue & EMS
- 123.8%Good Intent Call
- 72.2%False Alarm
- Fire incident types reported to NFIRS in Oakley, KS
- 10160.5%Outside Fires
- 3521.0%Mobile Property/Vehicle Fires
- 2515.0%Structure Fires
- 63.6%Other
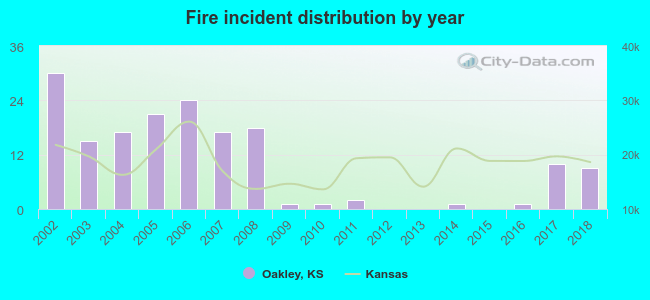 Based on the data from the years 2002 - 2018 the average number of fire incidents per year is 10. The highest number of fires - 30 took place in 2002, and the least - 0 in 2012. The data has a decreasing trend.
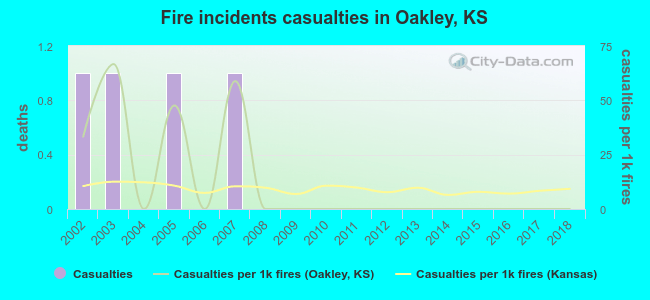 According to the data from the years 2002 - 2018 the average number of fire-related yearly casualties is 0. The highest number of reported casualties - 1 took place in 2002, and the lowest - 0 in 2004. The data has a dropping trend.
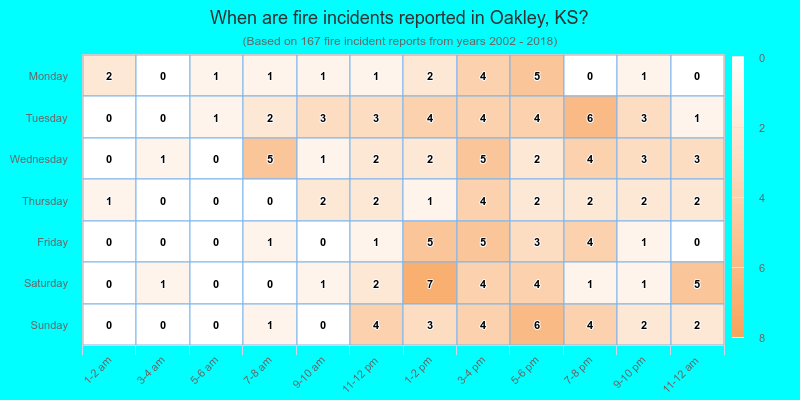
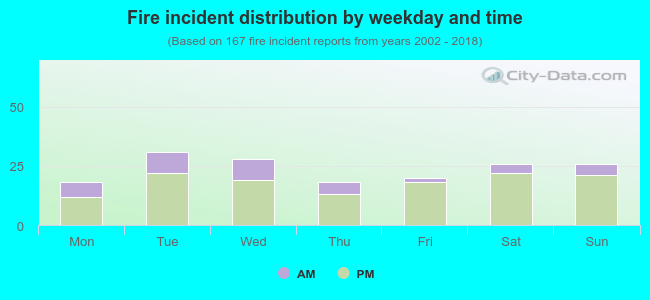 24.0% incidents where reported in the morning and 76.0% in the evening. The most fires (18.6%) took place on Tuesday, and the least (10.8%) on Monday.
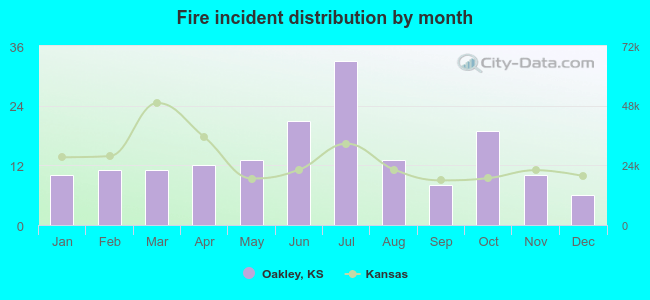 According to the 167 fires from years 2002 - 2018 most fires (19.8%) took place during July, and the least (3.6%) in December.
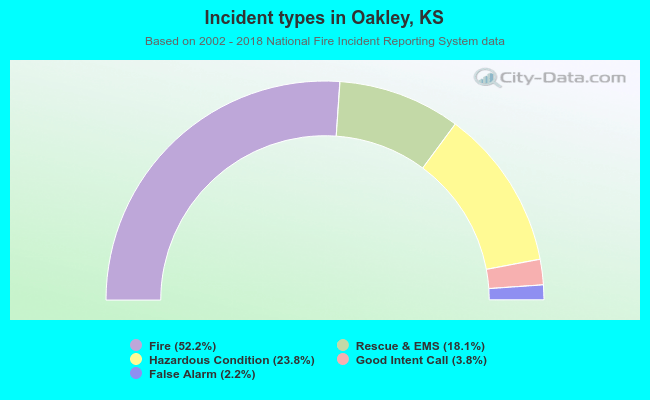 Out of all 320 cases reported during the years 2002 - 2018, the most belonged to the categories: Fire (52.2%), Rescue & EMS (23.8%), and Overpressure Rupture (18.1%).
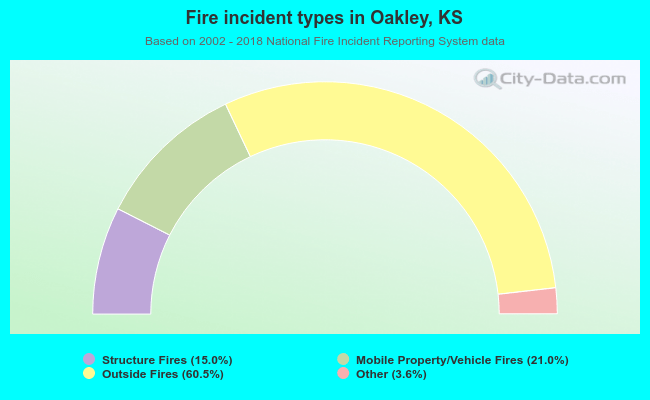 When looking into fire subcategories, the most incidents belonged to: Outside Fires (60.5%), and Mobile Property/Vehicle Fires (21.0%).