Oakwood: Fire Incidents, Ohio (OH)
Where are fire incidents reported in Oakwood, OH
Something went wrong! Please refresh the page.
|
| |||||||||||||||||||||||||||||||||||||||||||||||||||||||||||||||||||||||||||||||||||||||||||||||||||||||||||||
2002 - 2018 National Fire Incident Reporting System (NFIRS) incidents
- Incident types reported to NFIRS in Oakwood, OH
- 3,83055.2%Rescue & EMS
- 94613.6%Fire
- 91713.2%False Alarm
- 6018.7%Hazardous Condition
- 3865.6%Service Call
- 2063.0%Good Intent Call
- 190.3%Severe Weather
- 170.2%Special Incident
- 110.2%Overpressure Rupture
- Fire incident types reported to NFIRS in Oakwood, OH
- 57460.7%Structure Fires
- 18619.7%Outside Fires
- 13914.7%Mobile Property/Vehicle Fires
- 475.0%Other
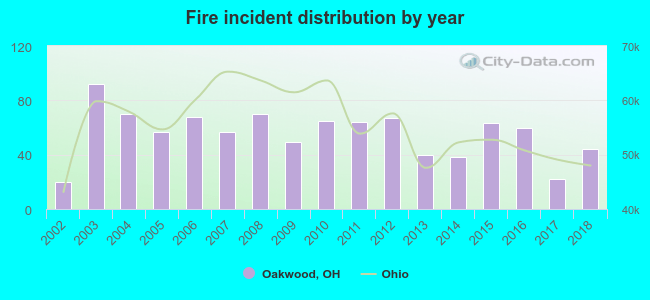 Based on the data from the years 2002 - 2018 the average number of fires per year is 56. The highest number of reported fires - 92 took place in 2003, and the least - 20 in 2002. The data has a rising trend.
The average number of yearly fire incidents per 10k residents in Oakwood, OH compared to nearest cities:
(Note: Based on data for the last 3 years, including only cities with population 5,000 and above)
| Oakwood: | 46.2 |
| Kettering: | 14.8 |
| Dayton: | 44.3 |
| Moraine: | 108.9 |
| Riverside: | 20.2 |
| West Carrollton City: | 1.2 |
| West Carrollton: | 35.8 |
| Centerville: | 14.6 |
| Beavercreek: | 4.4 |
 The median response time based on all reported fire incidents is 5 minutes. This is lower compared to the Ohio median value.
The median response time in Oakwood, OH compared to nearest cities:
(Note: Based on data for all years, including only cities with at least 500 fire incidents)
| Oakwood: | 5 minutes |
| Kettering: | 6 minutes |
| Dayton: | 5 minutes |
| Moraine: | 5 minutes |
| Riverside: | 6 minutes |
| West Carrollton: | 5 minutes |
| Centerville: | 7 minutes |
| Beavercreek: | 6 minutes |
| Miamisburg: | 6 minutes |
 31.1% incidents where reported in the morning and 68.9% in the evening. The most fires (16.1%) took place on Thursday, and the least (12.7%) on Saturday.
 Based on the 946 reports from years 2002 - 2018 most fires (10.9%) took place during April, and the least (5.1%) in December.
 Out of all 6,933 cases reported during the years 2002 - 2018, the most belonged to the categories: Rescue & EMS (55.2%), Fire (13.6%), and False Alarm (13.2%).
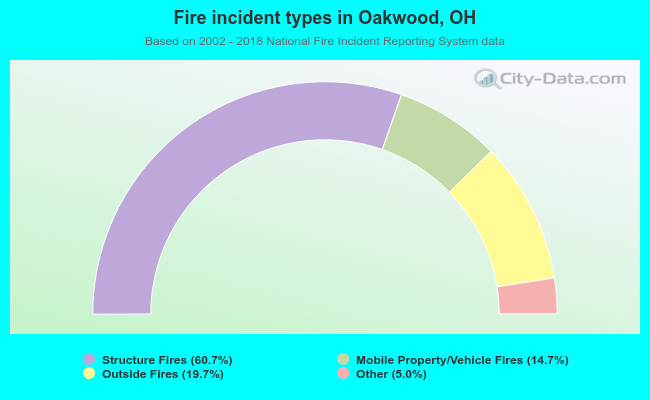 When looking into fire subcategories, the most incidents belonged to: Structure Fires (60.7%), and Outside Fires (19.7%).