| Fire incidents reported |
|---|
| Sreet name | Count |
|---|
| FM 489 | 16 | | FCR 261 | 10 | | FCR 301 | 10 | | HWY 84 | 10 | | HIGHWAY 84 | 8 | | CR 225 | 6 | | FCR 241 | 6 | | FCR 300 | 6 | | FCR 340 | 6 | | FCR 360 | 6 | | FCR 431 | 6 | | HWY 79 | 6 | | 380 FCR 261 | 4 | | 425 FCR 275 | 4 | | 821 FCR 275 | 4 | | CR 266 | 4 | | CR 294 | 4 | | FCR 271 | 4 | | FCR 275 | 4 | | FCR 311 | 4 | | FCR 350 | 4 | | FCR 371 | 4 | | FCR 489 | 4 | | FREESTONE COUNTY ROAD 302 | 4 | | INDIAN CREEK RANCH | 4 |
| | | Fire incidents reported |
|---|
| Sreet name | Count |
|---|
| US HIGHWAY 84 | 4 | | 000 | 2 | | 1 MILE WEST OF 489 ON HWY 84 | 2 | | 101 FCR 271 | 2 | | 102 FM 489 | 2 | | 1030 HIGHWAY 84 EAST | 2 | | 1030 US HIGHWAY 84 E | 2 | | 105 FCR 351 | 2 | | 105 FREESTONE CR 241 | 2 | | 1058 FM 489 | 2 | | 1063 HWY 84 | 2 | | 1087 FM 489 SOUTH | 2 | | 111 FCR 301 | 2 | | 111 PRIVATE ROAD 294 | 2 | | 1134 FM 489 | 2 | | 114 PR 365 | 2 | | 115 FCR 257 | 2 | | 115 FCR 369 | 2 | | 115 PR 369 | 2 | | 116 FCR 252 | 2 | | 116 FCR 350 | 2 | | 117 FCR 240 | 2 | | 1171 US HWY 84 | 2 | | 12 MILES OUT ON LEON CR 542 | 2 | | |
|
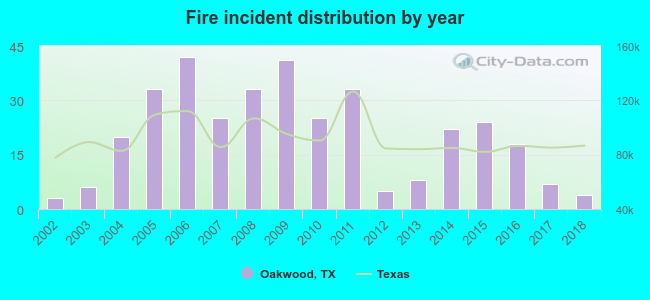 According to the data from the years 2002 - 2018 the average number of fires per year is 21. The highest number of reported fires - 42 took place in 2006, and the least - 3 in 2002. The data has a growing trend.
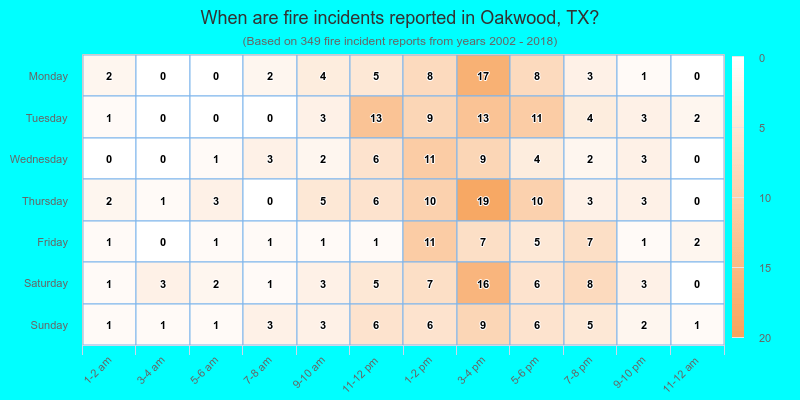
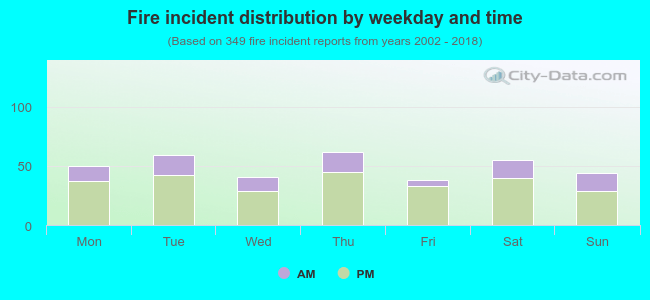 26.9% incidents where reported in the morning and 73.1% in the evening. The most fires (17.8%) took place on Thursday, and the least (10.9%) on Friday.
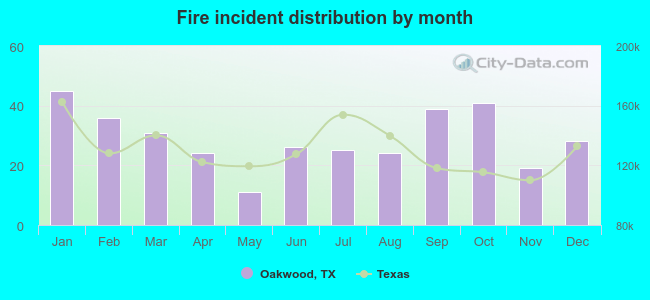 Based on the 349 fire incidents from years 2002 - 2018 most fires (12.9%) took place during January, and the least (3.2%) in May.
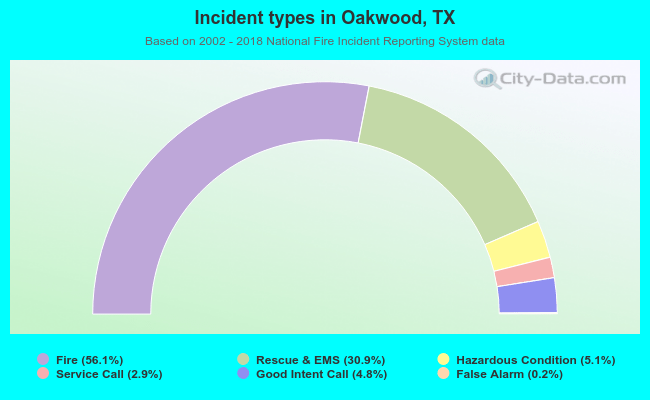 Out of all 622 cases reported during the years 2002 - 2018, the most belonged to the categories: Fire (56.1%), Overpressure Rupture (30.9%), and Rescue & EMS (5.1%).
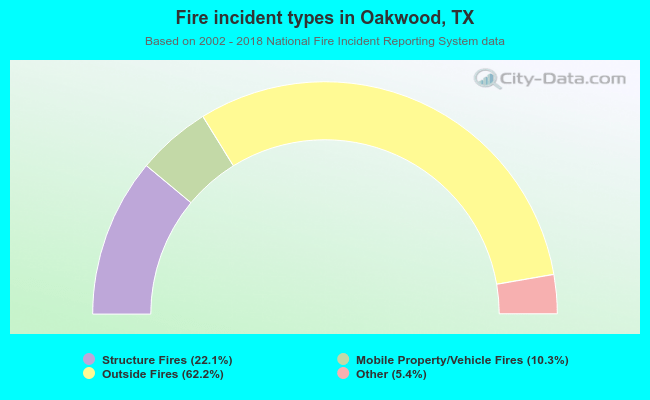 When looking into fire subcategories, the most reports belonged to: Outside Fires (62.2%), and Structure Fires (22.1%).