| Fire incidents reported |
|---|
| Sreet name | Count |
|---|
| HWY 165 HWY | 26 | | HWY 26 | 14 | | HWY 26 HWY | 14 | | 165 HWY | 12 | | HWY 165 | 10 | | HWY 165 SOUTH | 10 | | 7TH AVE | 6 | | COLE RD | 6 | | HWY 104 | 6 | | HWY 165 N | 6 | | HWY 26 E | 6 | | OBERLIN | 6 | | 1ST ST | 4 | | 2ND ST | 4 | | 3RD AVE | 4 | | 3RD AVENUE AVE | 4 | | 4TH STREET | 4 | | 7TH AVEN | 4 | | 9TH AVE | 4 | | 9TH. ST. D-4 | 4 | | HWY 1151 HWY | 4 | | HWY 165 NORTH HWY | 4 | | HWY 165 S | 4 | | HWY 165 SOUTH OF OBERLIN | 4 | | HWY 26 MILE MARKER 40 | 4 |
| | | Fire incidents reported |
|---|
| Sreet name | Count |
|---|
| HWY 26 W HWY | 4 | | MCMAHON RD | 4 | | MIGUEL ROAD | 4 | | MUSSELWHITE ROAD | 4 | | NEVILLE VIZENA | 4 | | NEVILLE VIZENA RD | 4 | | RIDER RD | 4 | | US HWY 165 S HWY | 4 | | 100 LC VIZENA ROAD | 2 | | 1003 3RD. ST. | 2 | | 104 COTTONGIN CASTOR RD | 2 | | 10TH AVE 4TH ST | 2 | | 1109 3RD AVE | 2 | | 123 5TH. ST | 2 | | 12TH AVE | 2 | | 12TH STREET | 2 | | 145 STEVE ALLEN RD | 2 | | 165 N REEDS BRIDGE | 2 | | 1ST | 2 | | 1ST | 2 | | 1ST STREET ST | 2 | | 2014 LAUDERDALE WOODYARD ROAD | 2 | | 212 N. FOURTH 4TH. ST. | 2 | | 225 BOND RD | 2 | | |
|
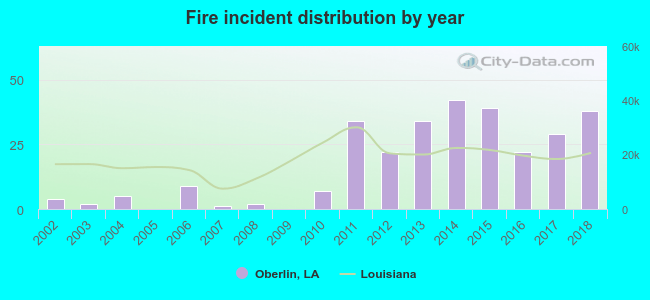 Based on the data from the years 2002 - 2018 the average number of fire incidents per year is 17. The highest number of reported fire incidents - 42 took place in 2014, and the least - 0 in 2005. The data has a rising trend.
 43.8% incidents where reported in the morning and 56.2% in the evening. The most fires (17.6%) took place on Wednesday, and the least (10.3%) on Thursday.
 According to the 290 fire incident reports from years 2002 - 2018 most fires (12.4%) took place during March, and the least (4.5%) in August.
 Out of all 1,459 cases reported during the years 2002 - 2018, the most belonged to the categories: Overpressure Rupture (54.6%), Fire (19.9%), and Rescue & EMS (11.7%).
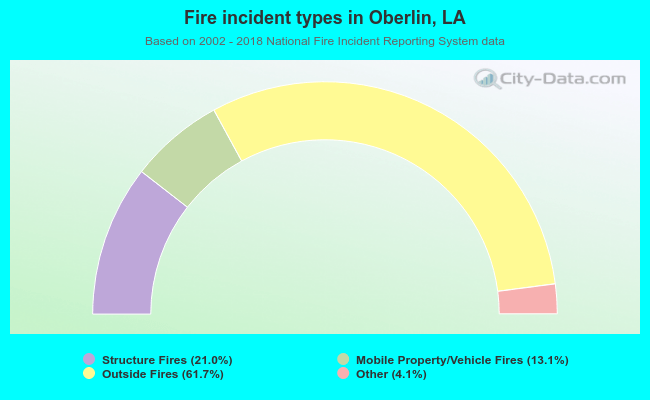 When looking into fire subcategories, the most incidents belonged to: Outside Fires (61.7%), and Structure Fires (21.0%).