Odessa: Fire Incidents, Missouri (MO)
Where are fire incidents reported in Odessa, MO
Something went wrong! Please refresh the page.
|
| |||||||||||||||||||||||||||||||||||||||||||||||||||||||||||||||||||||||||||||||||||||||||||||||||||||||||||||
| Other | 419 | |||||||||||||||||||||||||||||||||||||||||||||||||||||||||||||||||||||||||||||||||||||||||||||||||||||||||||||
2002 - 2018 National Fire Incident Reporting System (NFIRS) incidents
- Incident types reported to NFIRS in Odessa, MO
- 1,17535.4%Fire
- 94328.4%Rescue & EMS
- 41212.4%Good Intent Call
- 41112.4%Hazardous Condition
- 2176.5%Service Call
- 1303.9%False Alarm
- 170.5%Overpressure Rupture
- 100.3%Severe Weather
- Fire incident types reported to NFIRS in Odessa, MO
- 52644.8%Outside Fires
- 45138.4%Structure Fires
- 17114.6%Mobile Property/Vehicle Fires
- 272.3%Other
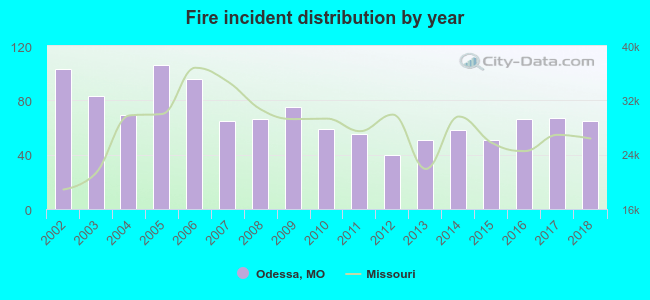 According to the data from the years 2002 - 2018 the average number of fires per year is 69. The highest number of fires - 106 took place in 2005, and the least - 40 in 2012. The data has a dropping trend.
The average number of yearly fire incidents per 10k residents in Odessa, MO compared to nearest cities:
(Note: Based on data for the last 3 years, including only cities with population 5,000 and above)
| Odessa: | 127.6 |
| Oak Grove: | 48.7 |
| Grain Valley: | 22.4 |
| Blue Springs: | 19.5 |
| Richmond: | 70.4 |
| Warrensburg: | 62.9 |
| Pleasant Hill: | 32.7 |
| Greenwood: | 23.1 |
| Independence: | 40.0 |
 The median response time based on all reported fire incidents is 9 minutes. This is higher compared to the Missouri median value.
The median response time in Odessa, MO compared to nearest cities:
(Note: Based on data for all years, including only cities with at least 500 fire incidents)
| Odessa: | 9 minutes |
| Oak Grove: | 8 minutes |
| Higginsville: | 8 minutes |
| Lexington: | 7 minutes |
| Grain Valley: | 6 minutes |
| Blue Springs: | 5 minutes |
| Richmond: | 7 minutes |
| Warrensburg: | 6 minutes |
| Pleasant Hill: | 8 minutes |
 27.2% incidents where reported in the morning and 72.8% in the evening. The most fires (18.7%) took place on Saturday, and the least (11.3%) on Tuesday.
 According to the 1,175 reports from years 2002 - 2018 most fires (16.1%) took place during March, and the least (5.3%) in June.
 Out of all 3,315 cases reported during the years 2002 - 2018, the most belonged to the categories: Fire (35.4%), Rescue & EMS (28.4%), and Good Intent Call (12.4%).
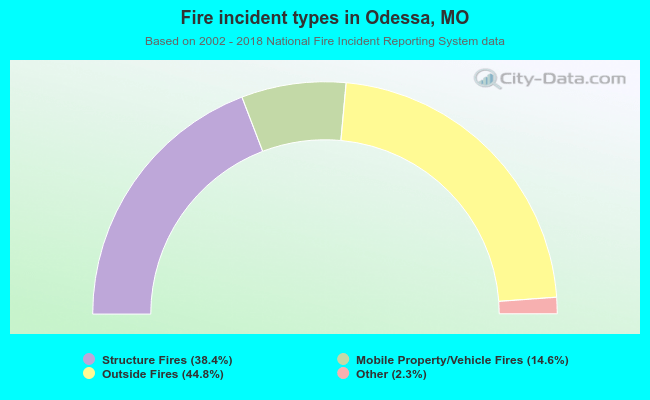 When looking into fire subcategories, the most reports belonged to: Outside Fires (44.8%), and Structure Fires (38.4%).