Oglesby: Fire Incidents, Texas (TX)
Where are fire incidents reported in Oglesby, TX
Something went wrong! Please refresh the page.
|
| |||||||||||||||||||||||||||||||||||||||||||||||||||||||||||||||||||||||||||||||||||||||||||||||||||||||||||||
| Other | 81 | |||||||||||||||||||||||||||||||||||||||||||||||||||||||||||||||||||||||||||||||||||||||||||||||||||||||||||||
2003 - 2018 National Fire Incident Reporting System (NFIRS) incidents
- Incident types reported to NFIRS in Oglesby, TX
- 35756.1%Fire
- 18929.7%Rescue & EMS
- 629.7%Good Intent Call
- 142.2%Hazardous Condition
- 111.7%Service Call
- 20.3%Severe Weather
- 10.2%False Alarm
- Fire incident types reported to NFIRS in Oglesby, TX
- 24167.5%Outside Fires
- 5716.0%Structure Fires
- 4111.5%Mobile Property/Vehicle Fires
- 185.0%Other
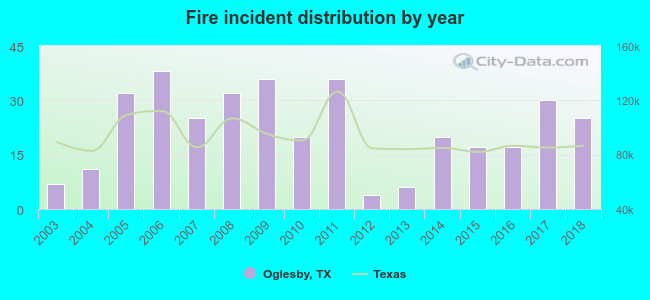 Based on the data from the years 2003 - 2018 the average number of fire incidents per year is 22. The highest number of reported fires - 38 took place in 2006, and the least - 4 in 2012. The data has a rising trend.
 23.5% incidents where reported in the morning and 76.5% in the evening. The most fires (17.9%) took place on Saturday, and the least (9.0%) on Tuesday.
 According to the 357 fires from years 2003 - 2018 most fires (14.0%) took place during July, and the least (5.0%) in October.
 Out of all 636 cases reported during the years 2003 - 2018, the most belonged to the categories: Fire (56.1%), Overpressure Rupture (29.7%), and Service Call (9.7%).
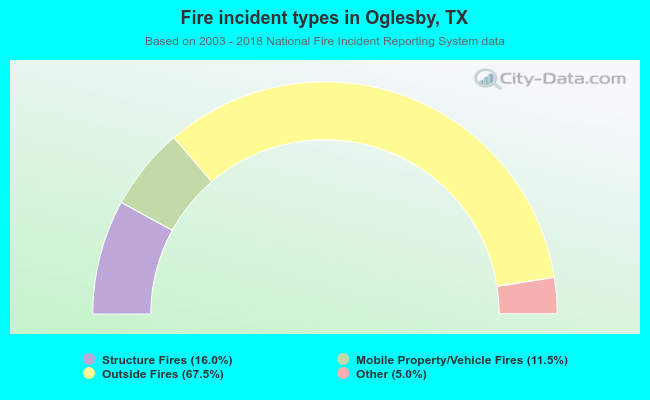 When looking into fire subcategories, the most reports belonged to: Outside Fires (67.5%), and Structure Fires (16.0%).