| Fire incidents reported |
|---|
| Sreet name | Count |
|---|
| STATE HIGHWAY 51 | 36 | | STATE HIGHWAY 8 | 32 | | 5TH ST | 8 | | MAIN ST | 8 | | OKLAHOMA | 8 | | HWY 51 | 6 | | OKLAHOMA AVE | 6 | | 6TH ST | 4 | | 8 MILE WEST OF OKEENE | 4 | | D ST | 4 | | SIXTH ST | 4 | | STATE HIGHWAY 8 LGTS | 4 | | 1 MILE E OF 51 51A JCT | 2 | | 1 W1S | 2 | | 12 E SOUTHARD 1 NHWY58 | 2 | | 2 MILE E OF HWY 51A ON CR 600 | 2 | | 201 INDUSTRIAL AVE | 2 | | 202 SOUTH PHILIPS | 2 | | 209 N SPRUCE | 2 | | 210 W BROADWAY | 2 | | 217 N. SPRUCE ST | 2 | | 268188 E 660 | 2 | | 2890 ROAD | 2 | | 4 EAST 2 SOUTH | 2 | | 407 N 6TH | 2 |
| | | Fire incidents reported |
|---|
| Sreet name | Count |
|---|
| 407 S. 6TH | 2 | | 418 S 5TH | 2 | | 421 SOUTH MAIN | 2 | | 5 SOUTH | 2 | | 51 HWY | 2 | | 51 HWY | 2 | | 5M S OF OKEENE ON HWY 51 | 2 | | 5TH | 2 | | 5TH AND BROADWAY | 2 | | 6 W OF OKEENE | 2 | | 6TH | 2 | | 8 N ON HWY 8 6 EAST | 2 | | 8 W OF OKEENE, OK | 2 | | ASH | 2 | | BROADWAY | 2 | | BROADWAY ST | 2 | | COLUMBUS | 2 | | EAST 51 | 2 | | F ST | 2 | | HIGHWAY 51 | 2 | | HIGHWAY 51 CIMARRON RIVER | 2 | | HIGHWAY 51 LGTS | 2 | | HIGHWAY 8 | 2 | | HWY8 | 2 | | |
|
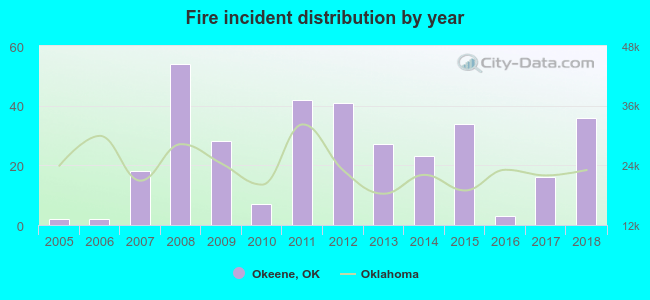 Based on the data from the years 2005 - 2018 the average number of fire incidents per year is 24. The highest number of fire incidents - 54 took place in 2008, and the least - 2 in 2005. The data has a rising trend.
 22.5% incidents where reported in the morning and 77.5% in the evening. The most fires (17.4%) took place on Thursday, and the least (10.8%) on Monday.
 According to the 334 reports from years 2005 - 2018 most fires (14.7%) took place during July, and the least (1.5%) in November.
 Out of all 454 cases reported during the years 2005 - 2018, the most belonged to the categories: Fire (73.6%), Overpressure Rupture (10.6%), and Rescue & EMS (8.8%).
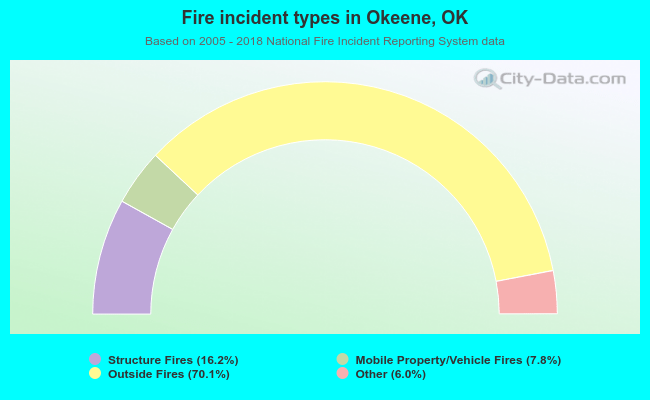 When looking into fire subcategories, the most incidents belonged to: Outside Fires (70.1%), and Structure Fires (16.2%).