Old Forge: Fire Incidents, Pennsylvania (PA)
Where are fire incidents reported in Old Forge, PA
Something went wrong! Please refresh the page.
|
| |||||||||||||||||||||||||||||||||||||||||||||||||||||||||||||||||||||||||||||||||||||||||||||||||||||||||||||
2005 - 2018 National Fire Incident Reporting System (NFIRS) incidents
- Incident types reported to NFIRS in Old Forge, PA
- 27226.4%Fire
- 22922.2%Hazardous Condition
- 13713.3%Rescue & EMS
- 13012.6%False Alarm
- 12812.4%Good Intent Call
- 868.3%Service Call
- 474.6%Severe Weather
- 30.3%Special Incident
- Fire incident types reported to NFIRS in Old Forge, PA
- 13750.4%Structure Fires
- 8932.7%Outside Fires
- 3713.6%Mobile Property/Vehicle Fires
- 93.3%Other
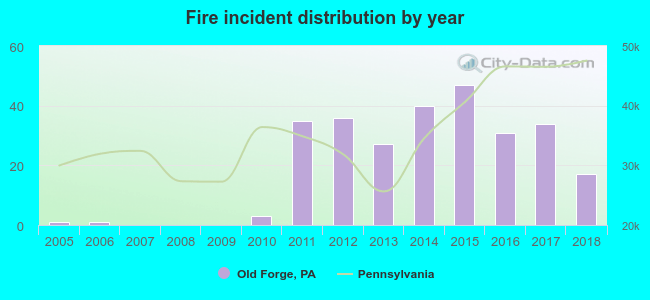 According to the data from the years 2005 - 2018 the average number of fire incidents per year is 19. The highest number of fire incidents - 47 took place in 2015, and the least - 0 in 2007. The data has a growing trend.
The average number of yearly fire incidents per 10k residents in Old Forge, PA compared to nearest cities:
(Note: Based on data for the last 3 years, including only cities with population 5,000 and above)
| Old Forge: | 33.3 |
| Moosic: | 42.2 |
| Taylor: | 4.9 |
| Pittston: | 52.9 |
| Scranton: | 21.6 |
| Exeter: | 58.3 |
| Dunmore: | 16.9 |
| Clarks Summit: | 28.3 |
| Swoyersville: | 4.7 |
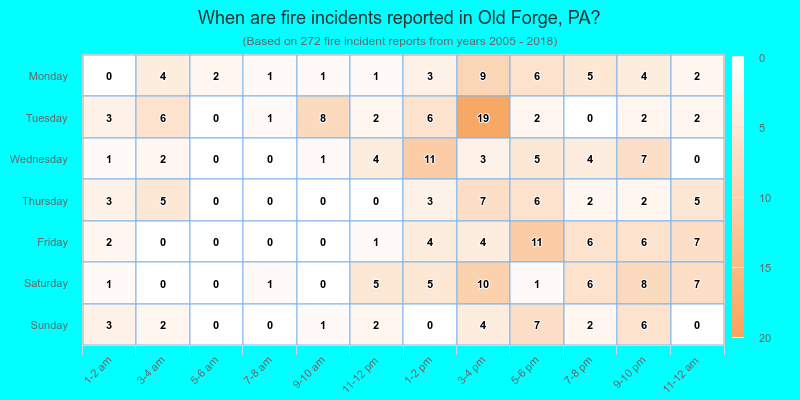
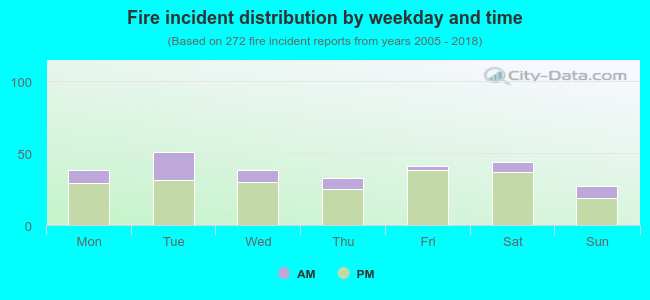 23.2% incidents where reported in the morning and 76.8% in the evening. The most fires (18.8%) took place on Tuesday, and the least (9.9%) on Sunday.
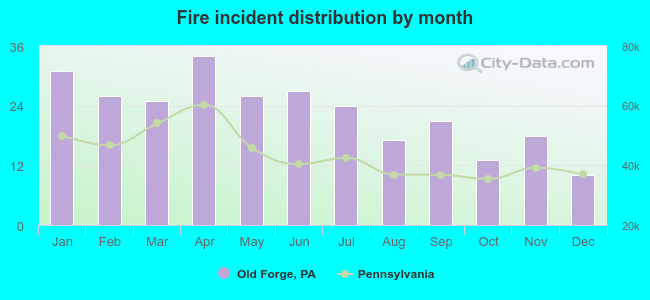 According to the 272 fire incident reports from years 2005 - 2018 most fires (12.5%) took place during April, and the least (3.7%) in December.
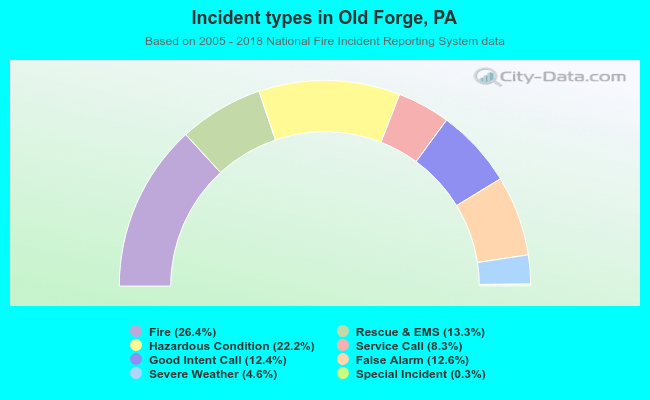 Out of all 1,032 cases reported during the years 2005 - 2018, the most belonged to the categories: Fire (26.4%), Rescue & EMS (22.2%), and Overpressure Rupture (13.3%).
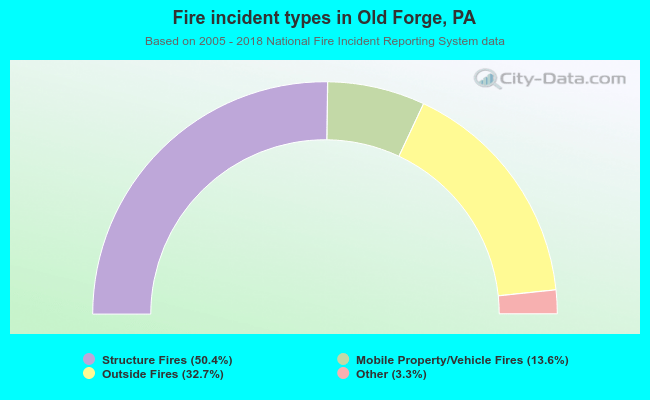 When looking into fire subcategories, the most reports belonged to: Structure Fires (50.4%), and Outside Fires (32.7%).