| Fire incidents reported |
|---|
| Sreet name | Count |
|---|
| MAIN ST | 48 | | MEMORIAL HWY | 30 | | ROUTE 73 | 24 | | JEFFERSON ST | 22 | | OLEY TURNPIKE RD | 22 | | CARRIAGE CIR | 18 | | MAIN ST | 18 | | OLEY TURNPIKE RD | 18 | | OLEY TURNPIKE ROAD | 18 | | RUPPERT SCHOOL RD | 16 | | FRIEDENSBURG (92) RD | 12 | | FRIEDENSBURG RD | 12 | | MAIN STREET | 12 | | ROSE VIRGINIA RD | 12 | | OYSTERDALE RD (89) | 10 | | PHILADELPHIA AV AVE | 10 | | BERTOLET MILL RD | 8 | | FRIEDENSBURG RD | 8 | | HUNTER RD | 8 | | MEMORIAL HIGHWAY | 8 | | MILL RD | 8 | | OLD STATE RD | 8 | | PHILADELPHIAROUTE 73 AVE | 8 | | ROUTE 73 OLEY RT | 8 | | SNYDER RD | 8 |
| | | Fire incidents reported |
|---|
| Sreet name | Count |
|---|
| APPLE(24) LN | 6 | | BERTOLET MILL RD | 6 | | BIEBER MILL RD | 6 | | CARRIAGE CIRCLEOLEY | 6 | | CLUB RD | 6 | | FREIDENBURG RD | 6 | | HUNTER RD | 6 | | JEFFERSON ST | 6 | | KAUFFMAN RD | 6 | | KINGS PLZ | 6 | | MAINOLEY ST | 6 | | ROUTE 662 | 6 | | ANNABETH RD | 4 | | APPLE LANE | 4 | | APPLE LN | 4 | | COVERED BRIDGE RD | 4 | | COVERED BRIDGE RD (92) | 4 | | DETURK RD | 4 | | FRIEDENSBURG RD. RD | 4 | | GOTWALS LN | 4 | | HAAS RD | 4 | | HAY RD | 4 | | HOCH RD | 4 | | HOCH ROAD | 4 | | |
|
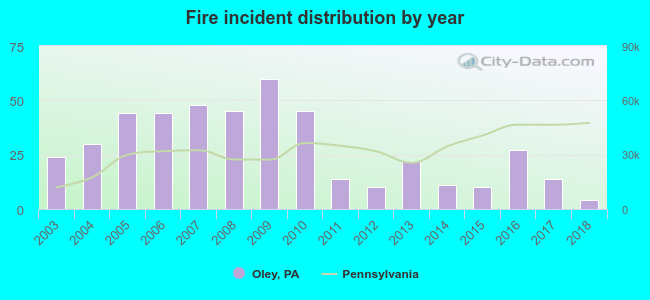 According to the data from the years 2003 - 2018 the average number of fire incidents per year is 28. The highest number of fire incidents - 60 took place in 2009, and the least - 4 in 2018. The data has a dropping trend.
 32.7% incidents where reported in the morning and 67.3% in the evening. The most fires (16.8%) took place on Friday, and the least (10.6%) on Wednesday.
 According to the 452 fire incident reports from years 2003 - 2018 most fires (20.8%) took place during April, and the least (3.1%) in August.
 Out of all 979 cases reported during the years 2003 - 2018, the most belonged to the categories: Fire (46.2%), Rescue & EMS (21.7%), and Overpressure Rupture (12.8%).
 When looking into fire subcategories, the most reports belonged to: Structure Fires (53.3%), and Outside Fires (30.8%).