Olla: Fire Incidents, Louisiana (LA)
Where are fire incidents reported in Olla, LA
Something went wrong! Please refresh the page.
|
| |||||||||||||||||||||||||||||||||||||||||||||||||||||||||||||||||||||||||||||||||||||||||||||||||||||||||||||
2002 - 2018 National Fire Incident Reporting System (NFIRS) incidents
- Incident types reported to NFIRS in Olla, LA
- 41182.0%Fire
- 285.6%Hazardous Condition
- 255.0%Service Call
- 163.2%False Alarm
- 132.6%Rescue & EMS
- 71.4%Good Intent Call
- 10.2%Special Incident
- Fire incident types reported to NFIRS in Olla, LA
- 25562.0%Outside Fires
- 10124.6%Structure Fires
- 5112.4%Mobile Property/Vehicle Fires
- 41.0%Other
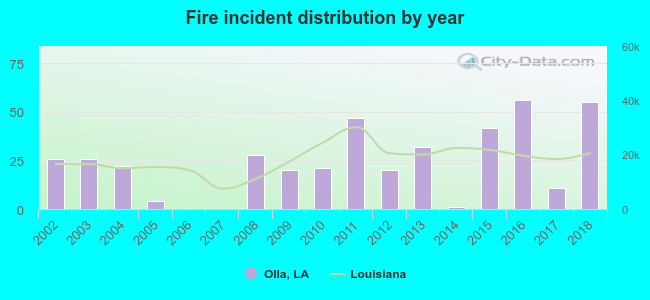 Based on the data from the years 2002 - 2018 the average number of fire incidents per year is 24. The highest number of reported fire incidents - 56 took place in 2016, and the least - 0 in 2006. The data has a rising trend.
 According to the data from the years 2002 - 2018 the average number of fire-related casualties per year is 0. The highest number of reported casualties - 1 took place in 2002, and the lowest - 0 in 2003. The data has a dropping trend.
 26.3% incidents where reported in the morning and 73.7% in the evening. The most fires (16.3%) took place on Friday, and the least (10.7%) on Saturday.
 Based on the 411 fires from years 2002 - 2018 most fires (12.7%) took place during March, and the least (6.1%) in April.
 Out of all 501 cases reported during the years 2002 - 2018, the most belonged to the categories: Fire (82.0%), Rescue & EMS (5.6%), and Hazardous Condition (5.0%).
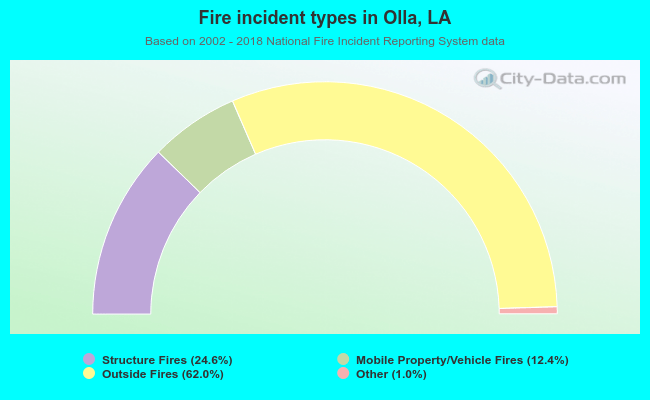 When looking into fire subcategories, the most incidents belonged to: Outside Fires (62.0%), and Structure Fires (24.6%).