| Fire incidents reported |
|---|
| Sreet name | Count |
|---|
| 1702 HWY 79 SOUTH | 6 | | FM 2178 | 6 | | 114 | 4 | | 1208 COUNTRY CLUB RD | 4 | | 1313 W GRAY | 4 | | 1768 | 4 | | 210 ANDERSON PLACE | 4 | | ANDREWS ROAD | 4 | | OAK | 4 | | 1 BANKHEAD DR | 2 | | 1008 W HAMILTON | 2 | | 1015 ARBOR | 2 | | 105 PLANO | 2 | | 106 HWY 79 NORTH | 2 | | 106 WESTERN | 2 | | 109 SPRINGCREEK | 2 | | 109 W GROVE | 2 | | 110 E CHERRY | 2 | | 1105 S AVE C | 2 | | 111 WEST MAIN | 2 | | 1118 W MAIN | 2 | | 116 LOOP 322 | 2 | | 1201 W MAIN | 2 | | 1210 HIGHLAND | 2 | | 122 WEST MAIN | 2 |
| | | Fire incidents reported |
|---|
| Sreet name | Count |
|---|
| 1319 RICHMOND | 2 | | 1339 W OAK | 2 | | 1400 W MAIN | 2 | | 1402 W ELM | 2 | | 1403 MOCKINGBIRD LN | 2 | | 1406 W MAIN | 2 | | 1410 WEST ELM | 2 | | 1411 MOCKINGBIRD | 2 | | 1768 & STOWE RD | 2 | | 1801 HWT 79 SOUTH | 2 | | 201 N AVE O | 2 | | 203 E YORK | 2 | | 205 E CHERRY | 2 | | 205 E MAIN | 2 | | 300 BLK S AVE G | 2 | | 300 E MAIN | 2 | | 300 S AVE E | 2 | | 300 W HAMILTON | 2 | | 306 N AVE F | 2 | | 309 HWY 79 SOUTH | 2 | | 311 W. OAK | 2 | | 3268 E HWY 114 | 2 | | 3329 AND 79 | 2 | | 333 1ST STREET MEGARGEL TX | 2 | | |
|
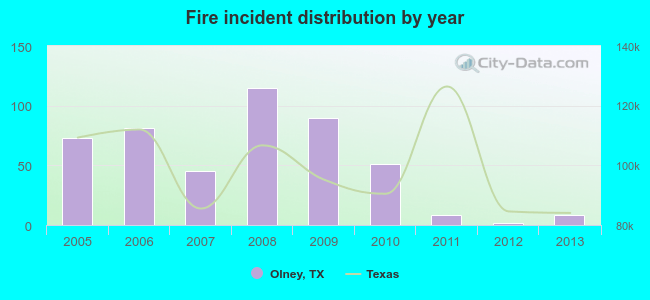 Based on the data from the years 2005 - 2013 the average number of fire incidents per year is 53. The highest number of reported fires - 115 took place in 2008, and the least - 2 in 2012. The data has a declining trend.
 28.7% incidents where reported in the morning and 71.3% in the evening. The most fires (19.8%) took place on Tuesday, and the least (11.8%) on Monday.
 According to the 474 fires from years 2005 - 2013 most fires (16.0%) took place during July, and the least (4.0%) in May.
 Out of all 519 cases reported during the years 2005 - 2013, the most belonged to the categories: Fire (91.3%), Overpressure Rupture (6.9%), and Rescue & EMS (1.5%).
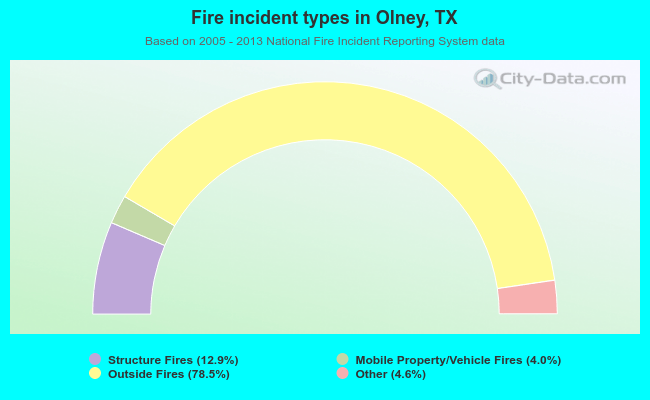 When looking into fire subcategories, the most reports belonged to: Outside Fires (78.5%), and Structure Fires (12.9%).