Olpe: Fire Incidents, Kansas (KS)
Where are fire incidents reported in Olpe, KS
Something went wrong! Please refresh the page.
|
| |||||||||||||||||||||||||||||||||||||||||||||||||||||||||||||||||||||||||||||||||||||||||||||||||||||||||||||
| Other | 85 | |||||||||||||||||||||||||||||||||||||||||||||||||||||||||||||||||||||||||||||||||||||||||||||||||||||||||||||
2002 - 2018 National Fire Incident Reporting System (NFIRS) incidents
- Incident types reported to NFIRS in Olpe, KS
- 35346.7%Rescue & EMS
- 26535.1%Fire
- 648.5%Good Intent Call
- 344.5%Hazardous Condition
- 192.5%False Alarm
- 131.7%Service Call
- 60.8%Severe Weather
- 20.3%Overpressure Rupture
- Fire incident types reported to NFIRS in Olpe, KS
- 21179.6%Outside Fires
- 2910.9%Structure Fires
- 228.3%Mobile Property/Vehicle Fires
- 31.1%Other
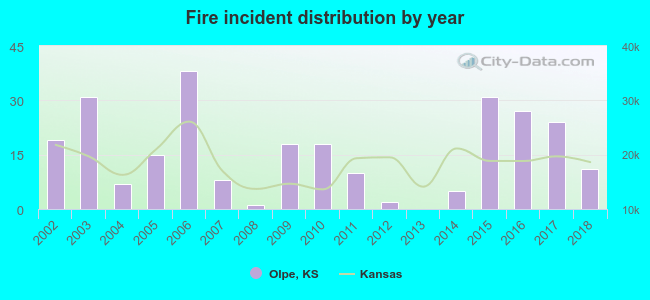 Based on the data from the years 2002 - 2018 the average number of fires per year is 16. The highest number of reported fire incidents - 38 took place in 2006, and the least - 0 in 2013. The data has a declining trend.
 26.4% incidents where reported in the morning and 73.6% in the evening. The most fires (18.1%) took place on Saturday, and the least (9.4%) on Friday.
 According to the 265 reports from years 2002 - 2018 most fires (23.0%) took place during April, and the least (1.1%) in June.
 Out of all 756 cases reported during the years 2002 - 2018, the most belonged to the categories: Rescue & EMS (46.7%), Fire (35.1%), and Good Intent Call (8.5%).
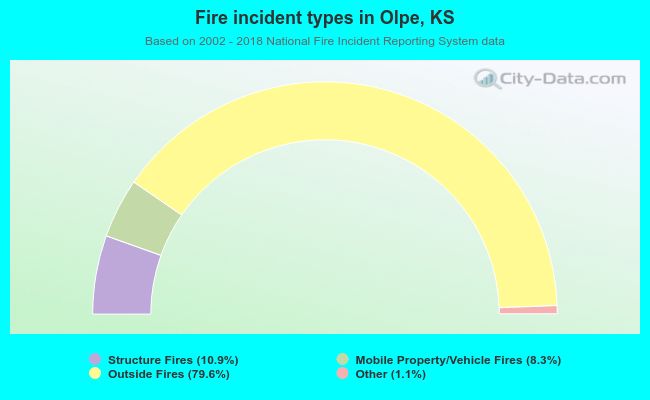 When looking into fire subcategories, the most incidents belonged to: Outside Fires (79.6%), and Structure Fires (10.9%).