Ontario: Fire Incidents, Ohio (OH)
Where are fire incidents reported in Ontario, OH
Something went wrong! Please refresh the page.
|
| |||||||||||||||||||||||||||||||||||||||||||||||||||||||||||||||||||||||||||||||||||||||||||||||||||||||||||||
2002 - 2018 National Fire Incident Reporting System (NFIRS) incidents
- Incident types reported to NFIRS in Ontario, OH
- 3,80174.2%Rescue & EMS
- 3086.0%Service Call
- 3005.9%False Alarm
- 2925.7%Good Intent Call
- 2404.7%Hazardous Condition
- 1703.3%Fire
- 70.1%Overpressure Rupture
- Fire incident types reported to NFIRS in Ontario, OH
- 7041.2%Outside Fires
- 6638.8%Structure Fires
- 3319.4%Mobile Property/Vehicle Fires
- 10.6%Other
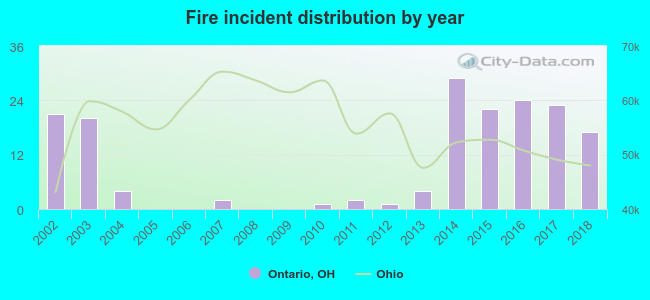 According to the data from the years 2002 - 2018 the average number of fires per year is 10. The highest number of fires - 29 took place in 2014, and the least - 0 in 2005. The data has a declining trend.
The average number of yearly fire incidents per 10k residents in Ontario, OH compared to nearest cities:
(Note: Based on data for the last 3 years, including only cities with population 5,000 and above)
| Ontario: | 34.8 |
| Mansfield: | 83.5 |
| Shelby: | 62.4 |
| Galion: | 54.7 |
| Ashland: | 43.4 |
| Bucyrus: | 55.4 |
| Willard: | 78.2 |
| Mount Vernon: | 60.2 |
| Marion: | 69.5 |

 27.6% incidents where reported in the morning and 72.4% in the evening. The most fires (20.0%) took place on Thursday, and the least (10.0%) on Wednesday.
 According to the 170 fires from years 2002 - 2018 most fires (21.8%) took place during April, and the least (2.4%) in October.
 Out of all 5,125 cases reported during the years 2002 - 2018, the most belonged to the categories: Rescue & EMS (74.2%), Service Call (6.0%), and False Alarm (5.9%).
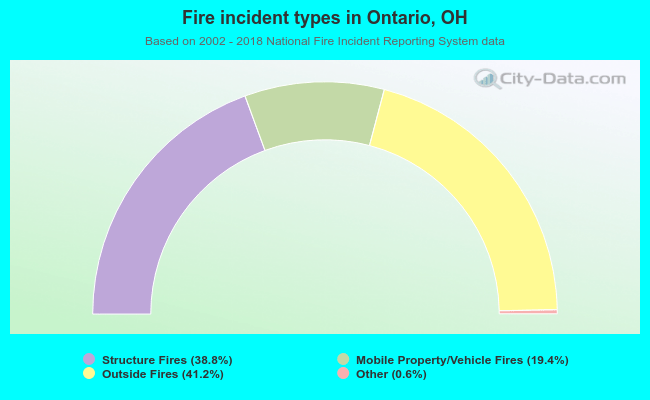 When looking into fire subcategories, the most incidents belonged to: Outside Fires (41.2%), and Structure Fires (38.8%).