| Fire incidents reported |
|---|
| Sreet name | Count |
|---|
| EAST OOLITIC RD | 22 | | HOOSIER AVE | 20 | | PEERLESS RD | 18 | | HIGHWAY 37 | 10 | | HIGHWAY 37 SOUTH | 10 | | INDIANA AVE | 10 | | KENTUCKY HOLLOW RD | 10 | | LAFAYETTE AVE | 10 | | COBB LN | 8 | | HIGHWAY 37 NORTH | 8 | | MASON ST | 8 | | JUDAH LOGAN RD | 6 | | OLD HIGHWAY 37 NORTH | 6 | | OOLITIC RD | 6 | | PATTON HILL RD | 6 | | SMITH AVE | 6 | | 11TH ST | 4 | | 9TH ST | 4 | | 9TH STREET | 4 | | BARLETTSVILLE ROAD | 4 | | BRIARWOOD AVE | 4 | | FARMER ST | 4 | | GRISSOM RD | 4 | | LARRY TINCHER LN | 4 | | MAIN ST | 4 |
| | | Fire incidents reported |
|---|
| Sreet name | Count |
|---|
| SHAWSWICK STATION ROAD | 4 | | SMITH AVE | 4 | | SPARKS DR | 4 | | SUGAR HILL RD | 4 | | TUNNELTON RD | 4 | | VALLEY LN | 4 | | VISTA DR | 4 | | WALNER QUARRY RD | 4 | | WALNUT HEIGHTS ST | 4 | | WALSH AVE | 4 | | WASHBOARD RD | 4 | | WESR TEDDY BIRD LANE | 4 | | 2ND STREET | 2 | | 4TH ST | 2 | | 5TH STREET | 2 | | 6TH ST | 2 | | 7TH ST | 2 | | 8TH ST | 2 | | ANDERSON LN | 2 | | ANDERSON RD | 2 | | ARTHUR ROAD | 2 | | BAILEY SCALES RD | 2 | | BENHAM LN | 2 | | BENNETT LN | 2 | | |
|
 Based on the data from the years 2002 - 2018 the average number of fires per year is 15. The highest number of fire incidents - 31 took place in 2010, and the least - 1 in 2002. The data has a growing trend.
 34.0% incidents where reported in the morning and 66.0% in the evening. The most fires (19.4%) took place on Saturday, and the least (10.3%) on Tuesday.
 According to the 253 reports from years 2002 - 2018 most fires (9.9%) took place during March, and the least (4.7%) in May.
 Out of all 702 cases reported during the years 2002 - 2018, the most belonged to the categories: Fire (36.0%), Overpressure Rupture (30.5%), and Severe Weather (13.5%).
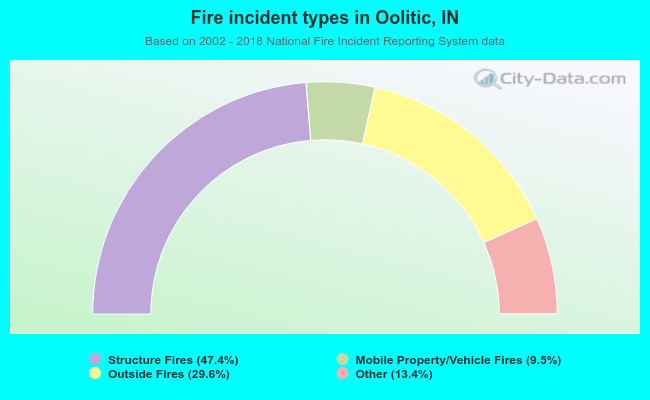 When looking into fire subcategories, the most reports belonged to: Structure Fires (47.4%), and Outside Fires (29.6%).