| Fire incidents reported |
|---|
| Sreet name | Count |
|---|
| HWY 113 | 16 | | HWY 9 SOUTH | 10 | | HWY 154 | 8 | | 113 SOUTH | 6 | | ARENA ROAD | 6 | | 490 HWY 9 | 4 | | ARENA RD | 4 | | BEHIND DOLLAR GENERAL | 4 | | HWY 113 SOUTH | 4 | | HWY 9 | 4 | | HWY 9 HWY | 4 | | SEQUOYA PARK | 4 | | # 12 BINGHAM ROAD RD | 2 | | # 3 RAY STREET | 2 | | # 9 MUNICIPAL DR. | 2 | | #1 ZIMMERMAN ROAD | 2 | | 1 COBY SHIP LANE | 2 | | 1 SEQUOYA RD | 2 | | 100 WATERPLANT RD | 2 | | 1009 ARENA RD | 2 | | 101 WATERPLANT RD | 2 | | 102 EAST PERRY CO. LINE | 2 | | 109 RIVERVIEW ROAD | 2 | | 113 | 2 | | 1134 ARENA RD | 2 |
| | | Fire incidents reported |
|---|
| Sreet name | Count |
|---|
| 1134 ARENA ROAD | 2 | | 1140 ARENA RD RD | 2 | | 115 HWY 9 SOUTH | 2 | | 1158 ARENA ROAD | 2 | | 123 BRANDEN RD | 2 | | 123 BRANDON RD | 2 | | 128 HWY 9 | 2 | | 1338 HWY 13 SOUTH | 2 | | 135 HWY 9 | 2 | | 137 RIVERVIEW ROAD | 2 | | 149 TODD ST | 2 | | 151 TODD ST | 2 | | 151 TODD ST. | 2 | | 154 TODD STREET | 2 | | 172 FRANCIS ST | 2 | | 179 FRANCIS ST | 2 | | 181 HWY 113S | 2 | | 186 RIVERVIEW ROAD | 2 | | 19 BING RD | 2 | | 19 PRICE LN LGTS | 2 | | 19 PRICE LN. | 2 | | 191 ST ELISABETH RD | 2 | | 2 WRAY ST | 2 | | 20 BRENT STREET | 2 | | |
|
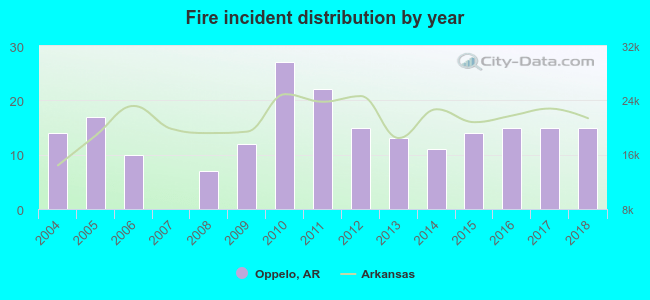 Based on the data from the years 2004 - 2018 the average number of fires per year is 14. The highest number of reported fires - 27 took place in 2010, and the least - 0 in 2007. The data has an increasing trend.
 19.8% incidents where reported in the morning and 80.2% in the evening. The most fires (17.4%) took place on Friday, and the least (10.1%) on Tuesday.
 Based on the 207 incident reports from years 2004 - 2018 most fires (17.9%) took place during January, and the least (3.9%) in May.
 Out of all 496 cases reported during the years 2004 - 2018, the most belonged to the categories: Rescue & EMS (50.2%), Fire (41.7%), and Hazardous Condition (2.6%).
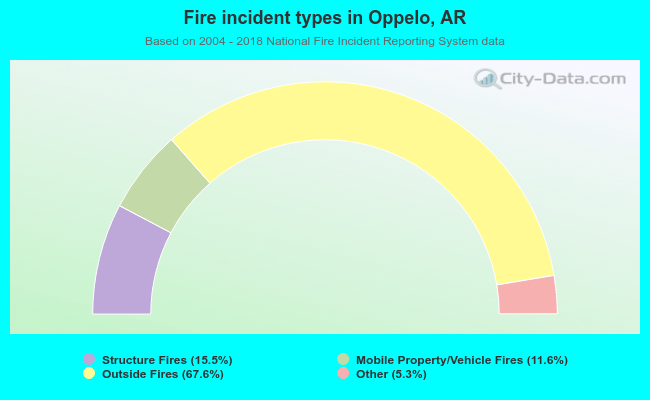 When looking into fire subcategories, the most reports belonged to: Outside Fires (67.6%), and Structure Fires (15.5%).