Orland: Fire Incidents, Indiana (IN)
Where are fire incidents reported in Orland, IN
Something went wrong! Please refresh the page.
|
| |||||||||||||||||||||||||||||||||||||||||||||||||
| Other | 297 | |||||||||||||||||||||||||||||||||||||||||||||||||
2003 - 2018 National Fire Incident Reporting System (NFIRS) incidents
- Incident types reported to NFIRS in Orland, IN
- 34546.6%Fire
- 10714.4%Hazardous Condition
- 10414.0%Good Intent Call
- 8811.9%Rescue & EMS
- 527.0%Special Incident
- 273.6%Service Call
- 81.1%Severe Weather
- 70.9%False Alarm
- 30.4%Overpressure Rupture
- Fire incident types reported to NFIRS in Orland, IN
- 16247.0%Outside Fires
- 11834.2%Structure Fires
- 5315.4%Mobile Property/Vehicle Fires
- 123.5%Other
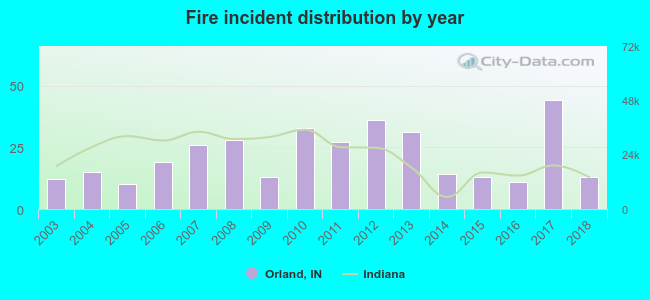 Based on the data from the years 2003 - 2018 the average number of fires per year is 22. The highest number of fire incidents - 44 took place in 2017, and the least - 10 in 2005. The data has a growing trend.
 According to the reports from the years 2003 - 2018 the average number of fire-related yearly casualties is 0. The highest number of casualties - 1 took place in 2003, and the lowest - 0 in 2004. The data has a decreasing trend.
 29.0% incidents where reported in the morning and 71.0% in the evening. The most fires (20.0%) took place on Saturday, and the least (12.2%) on Monday.
 Based on the 345 incident reports from years 2003 - 2018 most fires (17.4%) took place during March, and the least (2.9%) in September.
 Out of all 741 cases reported during the years 2003 - 2018, the most belonged to the categories: Fire (46.6%), Hazardous Condition (14.4%), and Good Intent Call (14.0%).
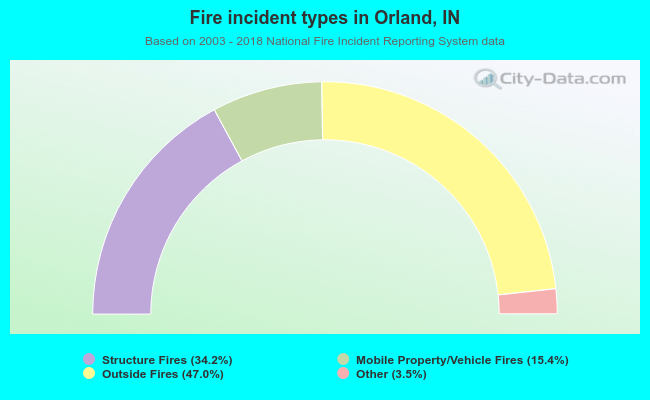 When looking into fire subcategories, the most incidents belonged to: Outside Fires (47.0%), and Structure Fires (34.2%).