| Fire incidents reported |
|---|
| Sreet name | Count |
|---|
| I-65 HWY | 66 | | I65 HWY | 60 | | HWY 52 HWY | 20 | | HWY 49 E. HWY | 14 | | PLEASANT HILL RD | 12 | | PRICE RD | 12 | | HIGHLAND RD | 10 | | DIXON RD | 8 | | BETHANY CHURCH RD | 6 | | CLAY GREGORY RD | 6 | | GREENWOOD RD | 6 | | PEPPER RD | 6 | | PRICE RD. RD | 6 | | S LAMONT RD | 6 | | W. CHURCH ST | 6 | | CANIDA RD | 4 | | COOK RD | 4 | | DOSS RD | 4 | | DUERS MILL RD | 4 | | EAST ROBERTSON RD | 4 | | HOLMES RD | 4 | | HULSEY RD | 4 | | HWY 49 E JUSTICE HWY | 4 | | HWY 49 HWY | 4 | | HWY. 49 E HWY | 4 |
| | | Fire incidents reported |
|---|
| Sreet name | Count |
|---|
| HWY. 49 E. HWY | 4 | | HWY. 52 HWY | 4 | | I-65 | 4 | | I-65 NORTH | 4 | | I65 SOUTH | 4 | | JUSTICE RD | 4 | | LAWRENCE RD | 4 | | MOORE ST | 4 | | S. LAMONT RD | 4 | | S.LAMONT RD | 4 | | W CHURCH ST | 4 | | 31 W HWY 52 HWY | 2 | | 49 & DOSS RD | 2 | | 49 E. HWY | 2 | | 52 HWY | 2 | | 8043 CLAY GREGORY ROAD RD | 2 | | 8273 HWY 52 HWY | 2 | | 8864 HWY 52 HWY | 2 | | 9621 HWY 49 E. | 2 | | BARRY DR | 2 | | BARRY DRIVE | 2 | | BETHANY CHURCH & PRICE RD | 2 | | BETHANY CHURCH PRICE RD | 2 | | BETHANY CHURCHHWY 49E RD | 2 | | CANIDA ROAD | 2 |
|
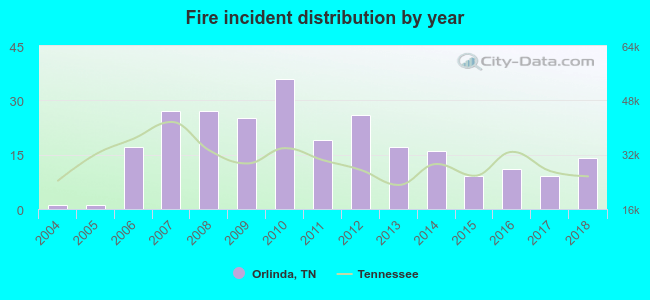 According to the data from the years 2004 - 2018 the average number of fires per year is 17. The highest number of reported fires - 36 took place in 2010, and the least - 1 in 2004. The data has a rising trend.
 30.2% incidents where reported in the morning and 69.8% in the evening. The most fires (20.4%) took place on Saturday, and the least (10.2%) on Tuesday.
 According to the 255 fire incidents from years 2004 - 2018 most fires (12.5%) took place during November, and the least (5.1%) in September.
 Out of all 1,060 cases reported during the years 2004 - 2018, the most belonged to the categories: Rescue & EMS (46.8%), Fire (24.1%), and Service Call (10.7%).
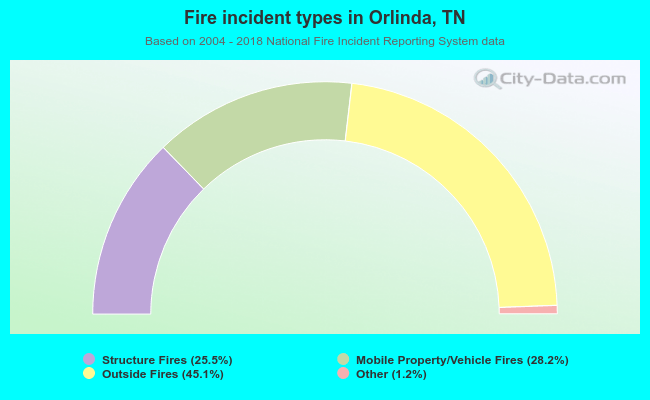 When looking into fire subcategories, the most incidents belonged to: Outside Fires (45.1%), and Mobile Property/Vehicle Fires (28.2%).