Orofino: Fire Incidents, Idaho (ID)
Where are fire incidents reported in Orofino, ID
Something went wrong! Please refresh the page.
|
| |||||||||||||||||||||||||||||||||||||||||||||||||||||||||||||||||||||||||||||||||||||||||||||||||||||||||||||
2002 - 2018 National Fire Incident Reporting System (NFIRS) incidents
- Incident types reported to NFIRS in Orofino, ID
- 37951.2%Fire
- 13918.8%Rescue & EMS
- 10313.9%Good Intent Call
- 486.5%Hazardous Condition
- 445.9%False Alarm
- 202.7%Service Call
- 40.5%Overpressure Rupture
- 30.4%Special Incident
- Fire incident types reported to NFIRS in Orofino, ID
- 17044.9%Structure Fires
- 15942.0%Outside Fires
- 4211.1%Mobile Property/Vehicle Fires
- 82.1%Other
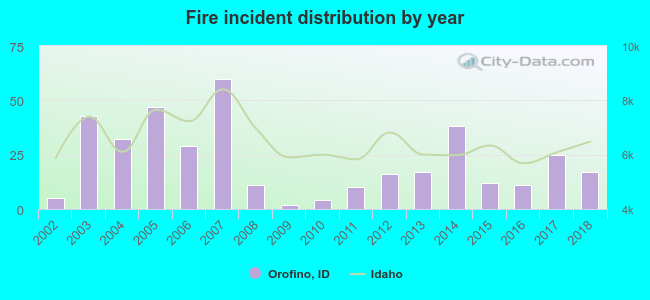 According to the data from the years 2002 - 2018 the average number of fires per year is 22. The highest number of fires - 60 took place in 2007, and the least - 2 in 2009. The data has an increasing trend.
 According to the data from the years 2002 - 2018 the average number of fire-related casualties per year is 1. The highest number of reported injuries - 5 took place in 2011, and the lowest - 0 in 2002. The data has a constant trend.
 27.2% incidents where reported in the morning and 72.8% in the evening. The most fires (17.4%) took place on Friday, and the least (10.3%) on Thursday.
 Based on the 379 fire incident reports from years 2002 - 2018 most fires (15.8%) took place during July, and the least (5.5%) in May.
 Out of all 740 cases reported during the years 2002 - 2018, the most belonged to the categories: Fire (51.2%), Rescue & EMS (18.8%), and Good Intent Call (13.9%).
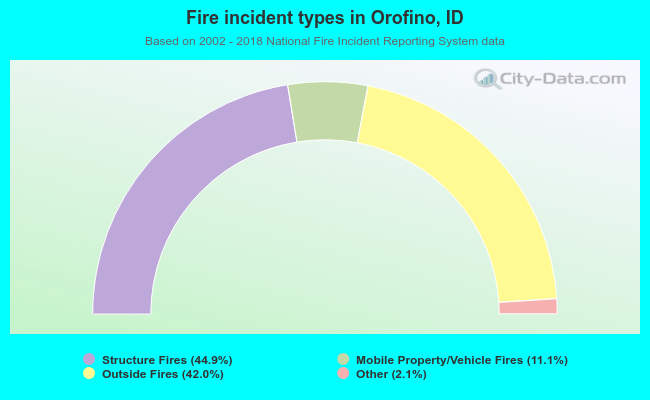 When looking into fire subcategories, the most reports belonged to: Structure Fires (44.9%), and Outside Fires (42.0%).