Oronogo: Fire Incidents, Missouri (MO)
Where are fire incidents reported in Oronogo, MO
Something went wrong! Please refresh the page.
|
| |||||||||||||||||||||||||||||||||||||||||||||||||||||||||||||||||||||||||||||||||||||||||||||||||||||||||||||
| Other | 140 | |||||||||||||||||||||||||||||||||||||||||||||||||||||||||||||||||||||||||||||||||||||||||||||||||||||||||||||
2002 - 2018 National Fire Incident Reporting System (NFIRS) incidents
- Incident types reported to NFIRS in Oronogo, MO
- 50542.8%Rescue & EMS
- 48441.0%Fire
- 574.8%Hazardous Condition
- 554.7%Good Intent Call
- 443.7%Service Call
- 322.7%False Alarm
- 20.2%Special Incident
- Fire incident types reported to NFIRS in Oronogo, MO
- 30763.4%Outside Fires
- 12325.4%Structure Fires
- 326.6%Mobile Property/Vehicle Fires
- 224.5%Other
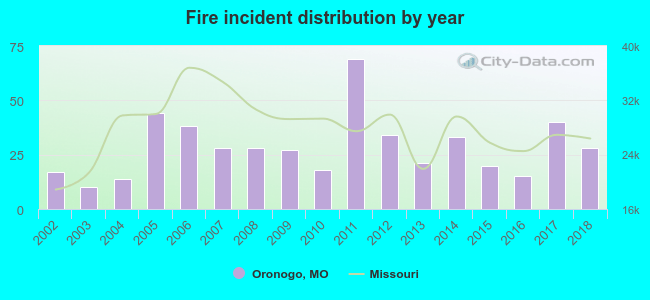 According to the data from the years 2002 - 2018 the average number of fires per year is 28. The highest number of fires - 69 took place in 2011, and the least - 10 in 2003. The data has a growing trend.
 25.4% incidents where reported in the morning and 74.6% in the evening. The most fires (16.3%) took place on Saturday, and the least (10.7%) on Thursday.
 Based on the 484 reports from years 2002 - 2018 most fires (14.9%) took place during January, and the least (3.9%) in October.
 Out of all 1,181 cases reported during the years 2002 - 2018, the most belonged to the categories: Rescue & EMS (42.8%), Fire (41.0%), and Hazardous Condition (4.8%).
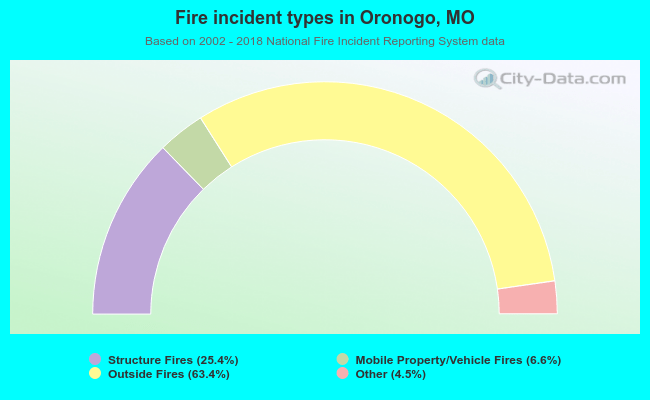 When looking into fire subcategories, the most reports belonged to: Outside Fires (63.4%), and Structure Fires (25.4%).