Osage: Fire Incidents, Iowa (IA)
Where are fire incidents reported in Osage, IA
Something went wrong! Please refresh the page.
|
| |||||||||||||||||||||||||||||||||||||||||||||||||||||||||||||||||||||||||||||||||||||||||||||||||||||||||||||
2002 - 2018 National Fire Incident Reporting System (NFIRS) incidents
- Incident types reported to NFIRS in Osage, IA
- 20167.9%Fire
- 279.1%Good Intent Call
- 206.8%False Alarm
- 196.4%Hazardous Condition
- 155.1%Rescue & EMS
- 134.4%Service Call
- 10.3%Severe Weather
- Fire incident types reported to NFIRS in Osage, IA
- 8039.8%Structure Fires
- 5627.9%Outside Fires
- 4120.4%Mobile Property/Vehicle Fires
- 2411.9%Other
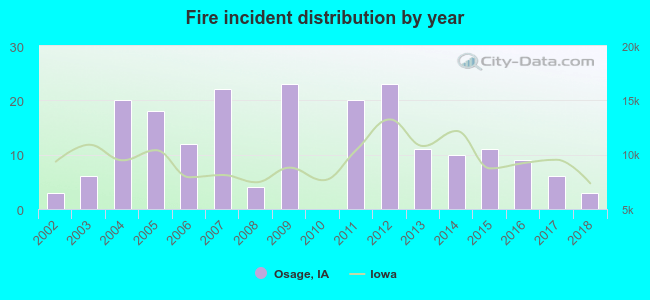 According to the data from the years 2002 - 2018 the average number of fire incidents per year is 12. The highest number of reported fire incidents - 23 took place in 2009, and the least - 0 in 2010. The data has a constant trend.
 According to the reports from the years 2002 - 2018 the average number of fire-related casualties per year is 0. The highest number of reported injuries - 2 took place in 2005, and the lowest - 0 in 2002. The data has a constant trend.
 26.9% incidents where reported in the morning and 73.1% in the evening. The most fires (18.9%) took place on Saturday, and the least (11.9%) on Monday.
 According to the 201 reports from years 2002 - 2018 most fires (18.4%) took place during April, and the least (3.5%) in February.
 Out of all 296 cases reported during the years 2002 - 2018, the most belonged to the categories: Fire (67.9%), Service Call (9.1%), and Good Intent Call (6.8%).
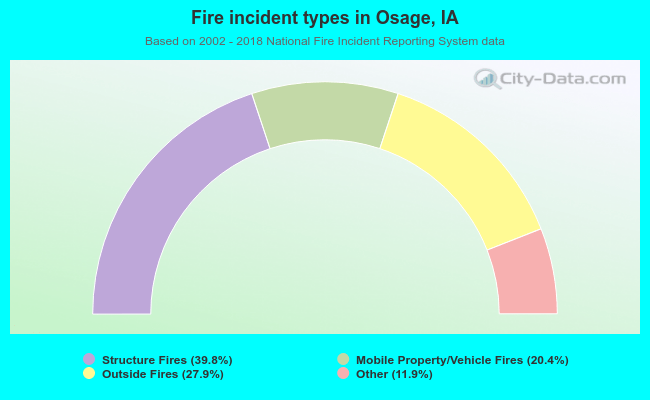 When looking into fire subcategories, the most reports belonged to: Structure Fires (39.8%), and Outside Fires (27.9%).