| Fire incidents reported |
|---|
| Sreet name | Count |
|---|
| OLD HWY 50 | 12 | | A HWY | 10 | | HIGHWAY 50 | 10 | | HWY 50 | 10 | | BB HWY | 8 | | 2547 BB HWY | 6 | | CONSERVATION DR | 6 | | LIPTON ROAD | 6 | | 2092 CONSERVATION DR | 4 | | 35 RED FOX RD. | 4 | | 4740 BB HWY | 4 | | 4855 QUAIL RD | 4 | | 6470 OLD HWY 50 | 4 | | BUTTERFIELD STAGE ROAD | 4 | | CONSERVATION DRIVE | 4 | | ELKSTOWN ROAD | 4 | | FRY ROAD | 4 | | HWY. 50 | 4 | | MT MORIAH ROAD | 4 | | NORTH BRIDGE | 4 | | OTTER CREEK DR | 4 | | OTTER CREEK DR | 4 | | OTTER CREEK DRIVE | 4 | | POTTERS FORD RD. | 4 | | QUAIL ROAD | 4 |
| | | Fire incidents reported |
|---|
| Sreet name | Count |
|---|
| US HWY 50 | 4 | | WASHINGTON RD. | 4 | | WILDLIFE ROAD | 4 | | 101 E UNION STREET | 2 | | 102 MORGAN COUNTY DRIVE | 2 | | 1051 A HWY | 2 | | 1060 BB HWY | 2 | | 1084 RE3D FOX RD | 2 | | 1086 RED FOX ROAD | 2 | | 12345 N HWY | 2 | | 129 OTTER DRIVE | 2 | | 1291 OTTER CREEK DR. | 2 | | 1310 FRY ROAD | 2 | | 135 HWY | 2 | | 135 SOUTH AND FRY RD. | 2 | | 1383 SOUTH HIGHWAY 135 | 2 | | 1430 BB HWY | 2 | | 1491 BB HWY | 2 | | 1501 A HWY | 2 | | 1501 A HWY. | 2 | | 1501 HWY. A | 2 | | 152 RED FOX RD | 2 | | 1620 OLD ROUTE 50 | 2 | | 1623 OTTER CREEK DR. | 2 | | |
|
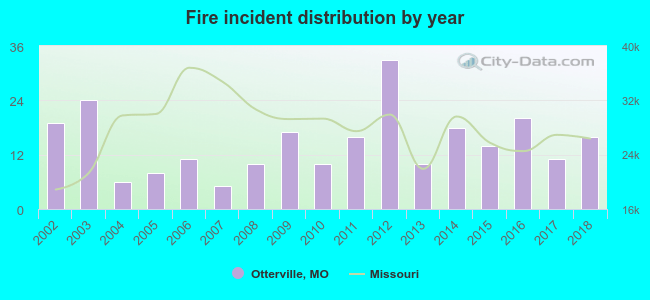 According to the data from the years 2002 - 2018 the average number of fires per year is 15. The highest number of fire incidents - 33 took place in 2012, and the least - 5 in 2007. The data has a declining trend.
 22.6% incidents where reported in the morning and 77.4% in the evening. The most fires (18.1%) took place on Saturday, and the least (11.3%) on Tuesday.
 According to the 248 fire incidents from years 2002 - 2018 most fires (16.1%) took place during March, and the least (3.6%) in May.
 Out of all 658 cases reported during the years 2002 - 2018, the most belonged to the categories: Overpressure Rupture (52.4%), Fire (37.7%), and Service Call (3.5%).
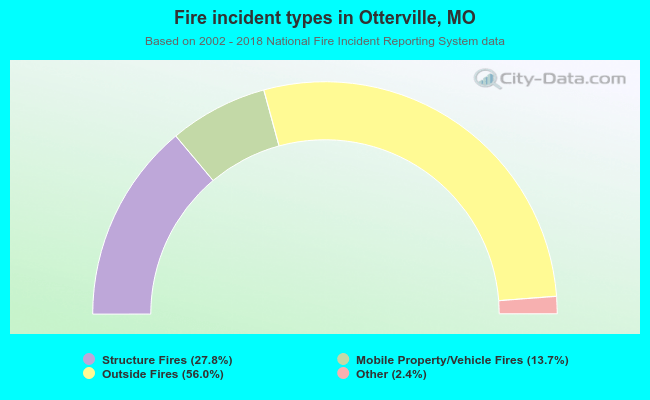 When looking into fire subcategories, the most reports belonged to: Outside Fires (56.0%), and Structure Fires (27.8%).