| Fire incidents reported |
|---|
| Sreet name | Count |
|---|
| STATE ROUTE 348 | 38 | | MT HOPE RD | 32 | | MOUNT HOPE RD | 26 | | ST RT 73 | 20 | | STATE ROUTE 73 | 20 | | BIG BEAR CK RD | 18 | | ADKINS HOFFER HILL RD | 14 | | ST. RT. 348 | 14 | | BEECHFORK RD | 12 | | RARDEN HAZALBAKER RD. | 12 | | BEECH FORK RD | 10 | | MT. UNGER RD | 10 | | RARDEN HAZALBAKER RD | 10 | | RARDENHAZELBAKER RD | 10 | | ROCKY FORK ROAD RD | 10 | | ADKINS HOFFER HILL RD | 8 | | ADKINS HOFFER HILL RD. | 8 | | BIG SPRUCE LITTLE BEAR CR RD | 8 | | DRY RUN RD | 8 | | HENLEY COMSTOCK ROAD RD | 8 | | PERRY RD | 8 | | PERRY RD. | 8 | | STATE ROUTE 348 RD | 8 | | THOMPSON HILL RD | 8 | | THOMPSON HILL ROAD RD | 8 |
| | | Fire incidents reported |
|---|
| Sreet name | Count |
|---|
| BIG SPRUCE LITTLE BEAR CK | 6 | | BRACKEN RIDGE RD | 6 | | CURTIS SMITH RD | 6 | | DAVIS HILL RD | 6 | | DODDS RD | 6 | | DODDS RD. | 6 | | EARL BROWN RD | 6 | | MT. HOPE RD. | 6 | | PERRY RD | 6 | | ROCKY FODK RD. | 6 | | ROCKY FORK RD | 6 | | ST . RT. 73 | 6 | | ST. RT. 73 | 6 | | BEECH FORK RD | 4 | | BIG BEAR CK. RD. | 4 | | BIG BEAR CREEK RD | 4 | | BLUE CREEK RD | 4 | | BRACKEN RIDGE RD | 4 | | DRY RUN RD. | 4 | | DRY RUN RD | 4 | | DRY RUN-MOUNT HOPE RD | 4 | | HACKWORTH HILL RD | 4 | | KIRKER RD | 4 | | KNOXEL HILL BRACKEN RIDGE | 4 | | |
|
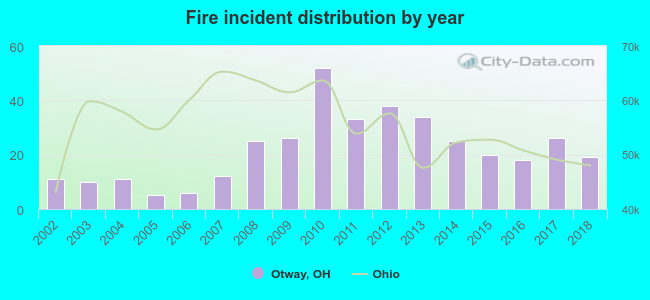 Based on the data from the years 2002 - 2018 the average number of fire incidents per year is 22. The highest number of reported fires - 52 took place in 2010, and the least - 5 in 2005. The data has an increasing trend.
 28.0% incidents where reported in the morning and 72.0% in the evening. The most fires (19.7%) took place on Saturday, and the least (10.5%) on Friday.
 According to the 371 incident reports from years 2002 - 2018 most fires (16.7%) took place during April, and the least (4.6%) in July.
 Out of all 609 cases reported during the years 2002 - 2018, the most belonged to the categories: Fire (60.9%), Overpressure Rupture (18.2%), and Rescue & EMS (11.0%).
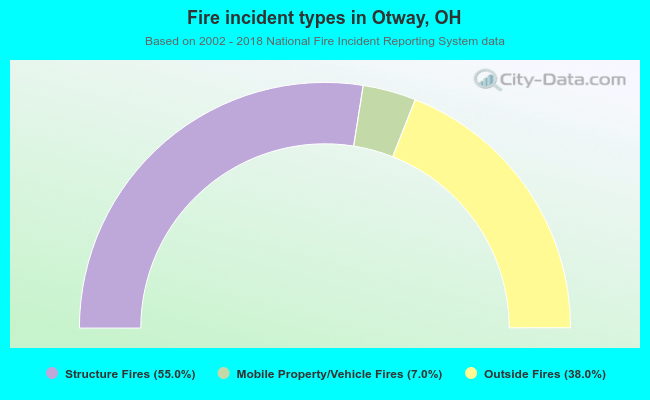 When looking into fire subcategories, the most reports belonged to: Structure Fires (55.0%), and Outside Fires (38.0%).