Owensburg: Fire Incidents, Indiana (IN)
Where are fire incidents reported in Owensburg, IN
Something went wrong! Please refresh the page.
| Fire incidents reported | |
|---|---|
| Sreet name | Count |
| HWY 45 HWY | 6 |
| MAIN ST | 6 |
| KOLEEN RD | 4 |
| R.R. 3 | 4 |
| HWY 58 | 2 |
| OWENSBURG RD | 2 |
| OWESNBURG RD | 2 |
| P.O. BOX 133 ` | 2 |
| R.R. 3 BOX 111 | 2 |
| R.R. 3 BOX 33C | 2 |
| STATE ROAD 45 HWY | 2 |
| W MAIN | 2 |
| WINE ST | 2 |
| Other | 67 |
2002 - 2017 National Fire Incident Reporting System (NFIRS) incidents
- Incident types reported to NFIRS in Owensburg, IN
- 13343.5%Rescue & EMS
- 10534.3%Fire
- 289.2%Hazardous Condition
- 206.5%Service Call
- 123.9%Good Intent Call
- 41.3%Special Incident
- 20.7%False Alarm
- 20.7%Severe Weather
- Fire incident types reported to NFIRS in Owensburg, IN
- 5249.5%Outside Fires
- 3937.1%Structure Fires
- 87.6%Mobile Property/Vehicle Fires
- 65.7%Other
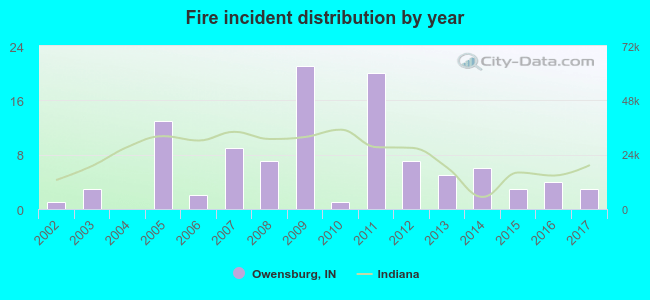 Based on the data from the years 2002 - 2017 the average number of fires per year is 7. The highest number of reported fire incidents - 21 took place in 2009, and the least - 0 in 2004. The data has a rising trend.
 29.5% incidents where reported in the morning and 70.5% in the evening. The most fires (20.0%) took place on Saturday, and the least (8.6%) on Wednesday.
 Based on the 105 incident reports from years 2002 - 2017 most fires (24.8%) took place during March, and the least (1.9%) in June.
 Out of all 306 cases reported during the years 2002 - 2017, the most belonged to the categories: Overpressure Rupture (43.5%), Fire (34.3%), and Rescue & EMS (9.2%).
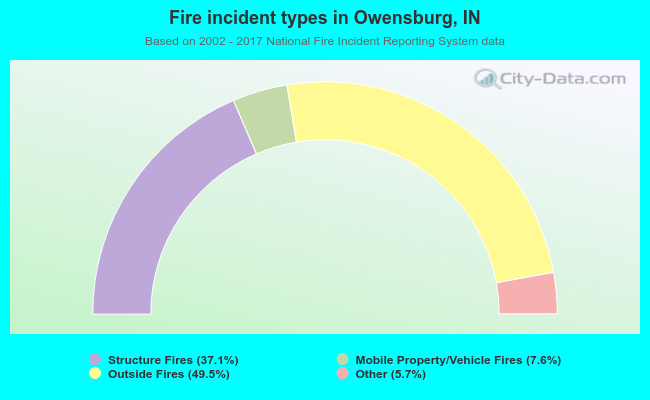 When looking into fire subcategories, the most incidents belonged to: Outside Fires (49.5%), and Structure Fires (37.1%).