Owings Mills: Fire Incidents, Maryland (MD)
Where are fire incidents reported in Owings Mills, MD
Something went wrong! Please refresh the page.
| Fire incidents reported | |
|---|---|
| Sreet name | Count |
| REISTERSTOWN RD | 264 |
| OWINGS MILLS BLVD | 120 |
| PAINTERS MILL RD | 70 |
| MILL RUN CIR | 64 |
| RED RUN BLVD | 48 |
| LAKESIDE BLVD | 46 |
| GARRISON FOREST RD | 44 |
| RICHMAR RD | 44 |
| ENCHANTED HILLS RD | 42 |
| WILLOW BEND DR | 42 |
| PLEASANT RIDGE DR | 38 |
| GROFFS MILL DR | 32 |
| TOLLGATE RD | 32 |
| I695*OWINGS MILLS BLVD | 26 |
| OWINGS MILLSFRANKLN | 26 |
| PHLOX CIR | 26 |
| ROSEWOOD LN | 26 |
| OWINGS MILLS*FRANKLN | 24 |
| STRAW HAT RD | 24 |
| DOLFIELD RD | 22 |
| GREENSPRING VALLEY RD | 22 |
| HUNTCLIFF DR | 22 |
| NEW TOWN BLVD | 22 |
| TAHOE CIR | 22 |
| OWINGS MILLS BL*I695 | 20 |
| MIDPINES CT | 16 |
| THISTLEDOWN RD | 16 |
| ASSOCIATED WAY | 14 |
| CAVES RD | 14 |
| CRONDALL LN | 14 |
| Other | 74 |
2004 - 2018 National Fire Incident Reporting System (NFIRS) incidents
- Incident types reported to NFIRS in Owings Mills, MD
- 17,68763.3%Rescue & EMS
- 3,13711.2%Hazardous Condition
- 2,3208.3%False Alarm
- 1,7256.2%Service Call
- 1,6605.9%Good Intent Call
- 1,3164.7%Fire
- 740.3%Overpressure Rupture
- Fire incident types reported to NFIRS in Owings Mills, MD
- 67151.0%Outside Fires
- 28121.4%Structure Fires
- 26920.4%Mobile Property/Vehicle Fires
- 957.2%Other
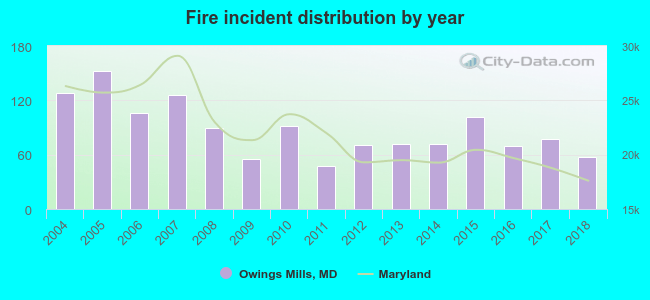 According to the data from the years 2004 - 2018 the average number of fire incidents per year is 88. The highest number of fires - 152 took place in 2005, and the least - 47 in 2011. The data has a decreasing trend.
The average number of yearly fire incidents per 10k residents in Owings Mills, MD compared to nearest cities:
(Note: Based on data for the last 3 years, including only cities with population 5,000 and above)
| Owings Mills: | 22.2 |
| Garrison: | 1.1 |
| Randallstown: | 23.4 |
| Reisterstown: | 22.8 |
| Pikesville: | 21.3 |
| Eldersburg: | 6.6 |
| Cockeysville: | 26.3 |
| Towson: | 13.6 |
| Catonsville: | 21.1 |
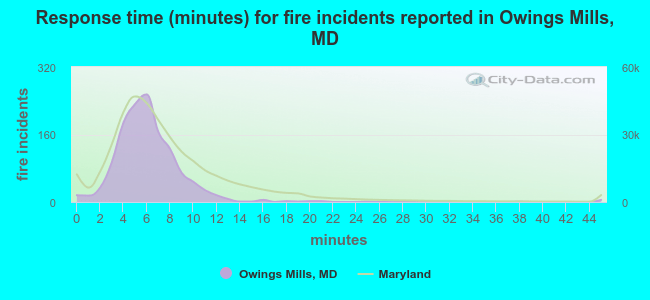 The median response time based on all reported fire incidents is 6 minutes. This is about the same as the Maryland median value.
The median response time in Owings Mills, MD compared to nearest cities:
(Note: Based on data for all years, including only cities with at least 500 fire incidents)
| Owings Mills: | 6 minutes |
| Randallstown: | 5 minutes |
| Reisterstown: | 6 minutes |
| Pikesville: | 5 minutes |
| Eldersburg: | 8 minutes |
| Cockeysville: | 5 minutes |
| Towson: | 5 minutes |
| Sykesville: | 10 minutes |
| Catonsville: | 5 minutes |
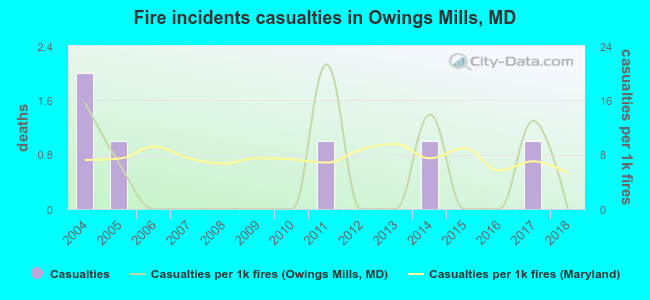 According to the reports from the years 2004 - 2018 the average number of fire-related casualties per year is 0. The highest number of casualties - 2 took place in 2004, and the lowest - 0 in 2006. The data has a declining trend.
The average number of casualties per 1,000 fires is 5. This indicator was the highest - 21 in 2011, and the lowest 0 in 2006. The trend for injuries per 1,000 incidents is decreasing. Compared to the Maryland value the number of injuries per 1,000 incidents is lower.
According to the reports from the years 2004 - 2018 the average number of fire-related casualties per year is 0. The highest number of casualties - 2 took place in 2004, and the lowest - 0 in 2006. The data has a declining trend.
The average number of casualties per 1,000 fires is 5. This indicator was the highest - 21 in 2011, and the lowest 0 in 2006. The trend for injuries per 1,000 incidents is decreasing. Compared to the Maryland value the number of injuries per 1,000 incidents is lower.Casualties per 1,000 incidents in Owings Mills, MD compared to nearest cities:
(Note: Based on data for all years, including only cities with at least 500 fire incidents)
| Owings Mills: | 4.6 |
| Randallstown: | 7.7 |
| Reisterstown: | 1.0 |
| Pikesville: | 4.2 |
| Eldersburg: | 9.4 |
| Cockeysville: | 4.4 |
| Towson: | 2.9 |
| Sykesville: | 8.6 |
| Catonsville: | 3.5 |
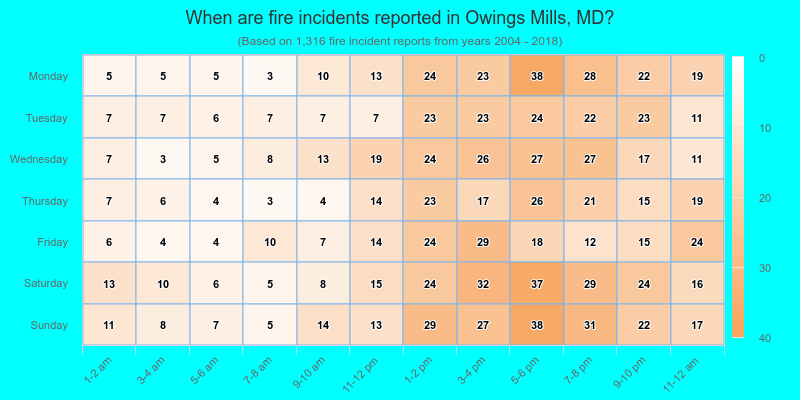
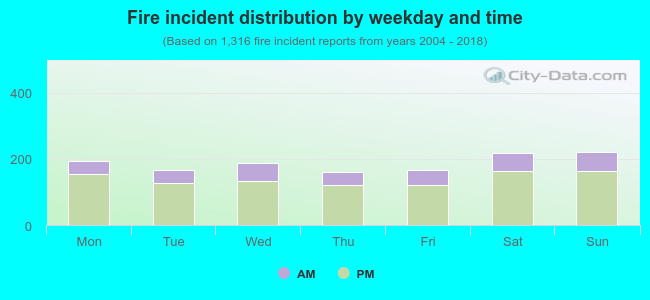 25.5% incidents where reported in the morning and 74.5% in the evening. The most fires (16.9%) took place on Sunday, and the least (12.1%) on Thursday.
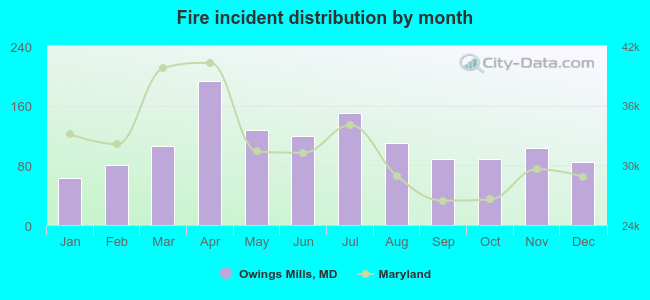 Based on the 1,316 reports from years 2004 - 2018 most fires (14.7%) took place during April, and the least (4.8%) in January.
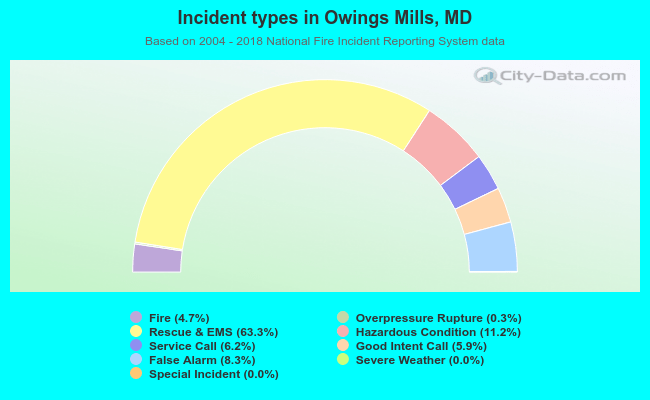 Out of all 27,935 cases reported during the years 2004 - 2018, the most belonged to the categories: Rescue & EMS (63.3%), Hazardous Condition (11.2%), and False Alarm (8.3%).
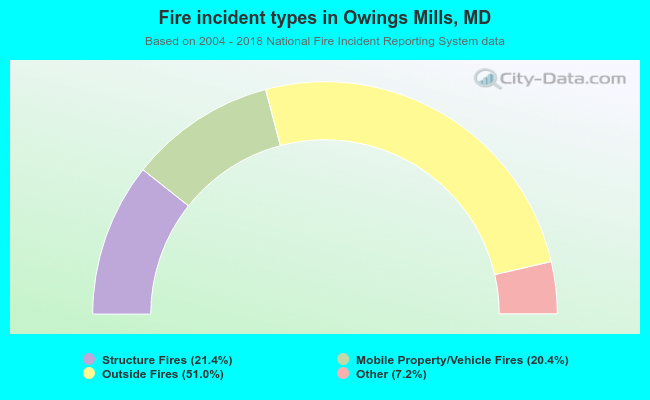 When looking into fire subcategories, the most incidents belonged to: Outside Fires (51.0%), and Structure Fires (21.4%).