| Fire incidents reported |
|---|
| Sreet name | Count |
|---|
| VALLEY RD | 18 | | BUCKLEY AVE | 16 | | AXFORD AVE | 14 | | BELVIDERE AVE | 14 | | WALL ST | 12 | | MECHANIC ST | 8 | | MT. PISCAH AVE | 8 | | MT. PISGAH AVE | 8 | | BUCKHORN DR | 6 | | HENDERSON ST | 6 | | JANES CHAPEL RD | 6 | | MINE HILL RD | 6 | | PEQUEST RD | 6 | | US. HIGHWAY 31 HWY | 6 | | VALLEY VIEW ESTATES | 6 | | BRASS CASTLE RD | 4 | | BUCKHORN | 4 | | CHURCH ST | 4 | | DEERFIELD RD | 4 | | JACKSON VALLEY RD | 4 | | JONESTOWN RD | 4 | | LINCOLN AVE | 4 | | MITCHELL RD | 4 | | OLD FORGE RD | 4 | | ORAMS LANE | 4 |
| | | Fire incidents reported |
|---|
| Sreet name | Count |
|---|
| SCRANTON PKY | 4 | | TOWNSBURY RD | 4 | | WASHINGTON AVE | 4 | | ACADEMY ST | 2 | | BIRCH DR | 2 | | BUCK HILL RD | 2 | | BUCKHORN DRIVE DR | 2 | | CAMBRIDGE EAST | 2 | | CARY RD | 2 | | CASTNERS RD | 2 | | CAT SWAMP RD | 2 | | CHURCH STREET | 2 | | CRESENT DR | 2 | | DEERFIELD DR | 2 | | FIELDSTONE CT | 2 | | FOREST LN | 2 | | FOX FARM RD | 2 | | HARTMANS CORNER RD | 2 | | HAZEN OXFORD ROAD | 2 | | HILLSIDE RD | 2 | | HOYT LN | 2 | | JACKSON VALLEY ORCH | 2 | | KENT STREET | 2 | | KNOWLTON RD | 2 | | |
|
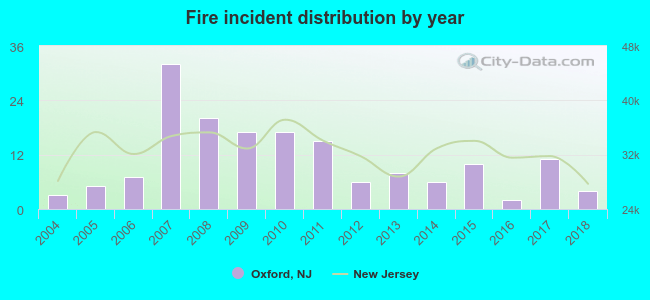 According to the data from the years 2004 - 2018 the average number of fire incidents per year is 11. The highest number of reported fire incidents - 32 took place in 2007, and the least - 2 in 2016. The data has a rising trend.
 33.7% incidents where reported in the morning and 66.3% in the evening. The most fires (20.9%) took place on Monday, and the least (9.8%) on Thursday.
 Based on the 163 fire incident reports from years 2004 - 2018 most fires (19.0%) took place during March, and the least (3.7%) in July.
 Out of all 547 cases reported during the years 2004 - 2018, the most belonged to the categories: Hazardous Condition (33.1%), Fire (29.8%), and Good Intent Call (14.4%).
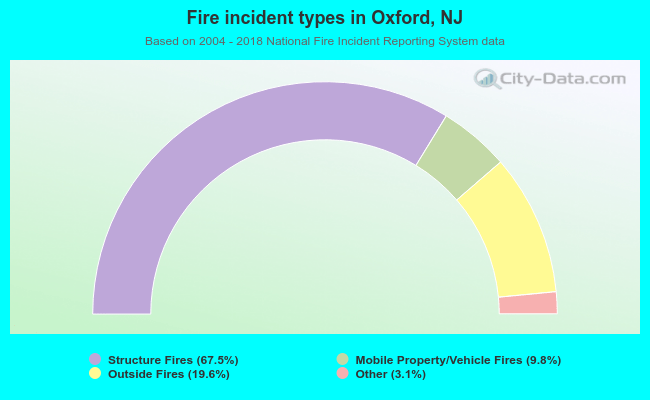 When looking into fire subcategories, the most incidents belonged to: Structure Fires (67.5%), and Outside Fires (19.6%).