| Fire incidents reported |
|---|
| Sreet name | Count |
|---|
| STATE HWY 12 | 42 | | COUNTY RD 18 | 28 | | HOBEN RD | 20 | | TURNER ST | 20 | | COUNTY RD 32 | 14 | | COUNTY RD 4 | 14 | | OLD VIRGINIA RD | 14 | | TAYLOR ST | 14 | | WILCOX RD | 14 | | CHARLES KELLEY RD | 12 | | COUNTY RD 3 | 12 | | N WASHINGTON | 12 | | STATE HWY 220 | 12 | | ROACH RD | 10 | | WAKEFIELD LN | 10 | | COUNTY RD 17 | 8 | | COUNTY RD 27 | 8 | | MAIN ST | 8 | | MECHANIC ST | 8 | | N CANAL ST | 8 | | NEW VIRGINIA RD | 8 | | OWLVILLE RD | 8 | | STONE QUARRY HILL RD | 8 | | BROOKSBANK RD | 6 | | CHARLES KELLEY RD | 6 |
| | | Fire incidents reported |
|---|
| Sreet name | Count |
|---|
| COLUMBIA ST | 6 | | KILROY RD | 6 | | MACGUIRE LN | 6 | | S WASHINGTON AV | 6 | | SCOTT ST | 6 | | WILLIAMS RD | 6 | | ALBANY ST | 4 | | BLIVEN-SHERMAN RD | 4 | | BRADLEY HILL RD | 4 | | BUTLER ST | 4 | | COUNTY RD 35 | 4 | | COUNTY ROUTE 27 | 4 | | COUNTY ROUTE 3 | 4 | | COUNTY ROUTE 32 | 4 | | CTY RTE 4 | 4 | | DAVIS LANE | 4 | | FRED WILCOX RD | 4 | | KENT LN | 4 | | KILROY RD | 4 | | KING RD | 4 | | MCNAMARA LN | 4 | | N CANAL | 4 | | N WASHINGTON AV | 4 | | NORTH RD | 4 | | ROACH RD | 4 |
|
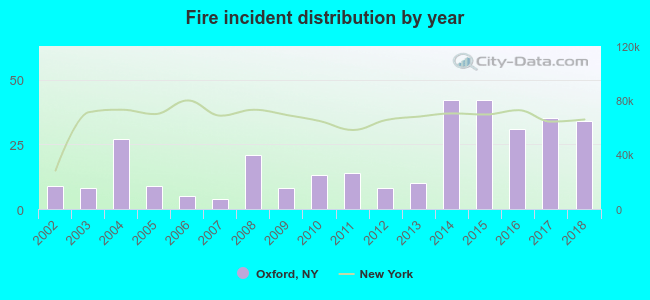 According to the data from the years 2002 - 2018 the average number of fire incidents per year is 19. The highest number of reported fires - 42 took place in 2014, and the least - 4 in 2007. The data has a rising trend.
 30.6% incidents where reported in the morning and 69.4% in the evening. The most fires (17.5%) took place on Tuesday, and the least (11.6%) on Sunday.
 Based on the 320 reports from years 2002 - 2018 most fires (16.6%) took place during April, and the least (3.8%) in June.
 Out of all 3,754 cases reported during the years 2002 - 2018, the most belonged to the categories: Rescue & EMS (66.1%), Hazardous Condition (12.8%), and Fire (8.5%).
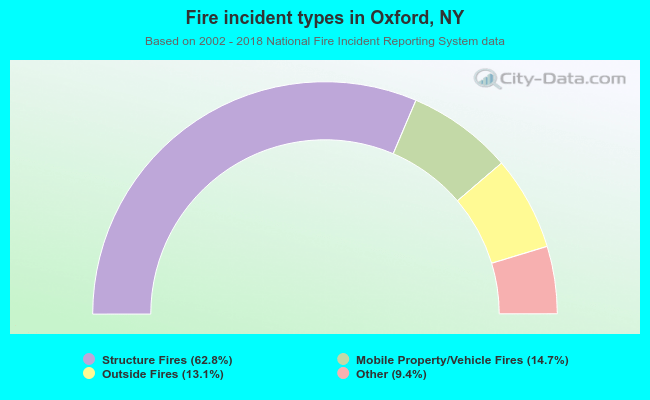 When looking into fire subcategories, the most reports belonged to: Structure Fires (62.8%), and Mobile Property/Vehicle Fires (14.7%).