Oxford: Fire Incidents, Ohio (OH)
Where are fire incidents reported in Oxford, OH
Something went wrong! Please refresh the page.
| Fire incidents reported | |
|---|---|
| Sreet name | Count |
| COLLEGE CORNER PIKE | 230 |
| HIGH ST | 218 |
| MAIN ST | 106 |
| WESTERN COLLEGE DR | 104 |
| CAMPUS AVE | 86 |
| MAPLE ST | 86 |
| POPLAR ST | 76 |
| LOCUST ST | 74 |
| COLLEGE AVE | 70 |
| TALLAWANDA RD | 66 |
| SOUTHPOINTE DR | 60 |
| SPRING ST | 60 |
| CHURCH ST | 50 |
| STILLWELL BECKETT RD | 50 |
| OAK ST | 48 |
| SYCAMORE ST | 48 |
| MILLVILLE OXFORD RD | 40 |
| CHESTNUT ST | 36 |
| FISHER DR | 36 |
| VINE ST | 34 |
| WITHROW ST | 34 |
| ARROWHEAD DR | 32 |
| BEECH ST | 32 |
| BROWN RD | 32 |
| OXFORD TRENTON | 32 |
| COLLINS ST | 30 |
| BONHAM RD | 28 |
| HAMILTON RICHMOND RD | 28 |
| MORNING SUN RD | 28 |
| PATTERSON AVE | 28 |
2002 - 2018 National Fire Incident Reporting System (NFIRS) incidents
- Incident types reported to NFIRS in Oxford, OH
- 2,33632.3%False Alarm
- 1,76024.3%Fire
- 1,08415.0%Hazardous Condition
- 93813.0%Rescue & EMS
- 6739.3%Good Intent Call
- 3695.1%Service Call
- 330.5%Overpressure Rupture
- 240.3%Special Incident
- 160.2%Severe Weather
- Fire incident types reported to NFIRS in Oxford, OH
- 97055.1%Structure Fires
- 64836.8%Outside Fires
- 1377.8%Mobile Property/Vehicle Fires
- 50.3%Other
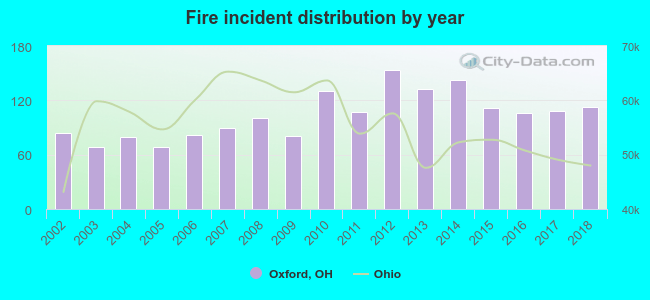 Based on the data from the years 2002 - 2018 the average number of fire incidents per year is 104. The highest number of reported fires - 154 took place in 2012, and the least - 68 in 2003. The data has an increasing trend.
The average number of yearly fire incidents per 10k residents in Oxford, OH compared to nearest cities:
(Note: Based on data for the last 3 years, including only cities with population 5,000 and above)
| Oxford: | 50.0 |
| Hamilton: | 65.6 |
| Trenton: | 34.0 |
| Fairfield: | 23.7 |
| Harrison: | 54.4 |
| Eaton: | 75.9 |
| Forest Park: | 42.0 |
| Middletown: | 44.0 |
| Springdale: | 78.8 |
 The median response time based on all reported fire incidents is 7 minutes. This is similar to the Ohio median value.
The median response time in Oxford, OH compared to nearest cities:
(Note: Based on data for all years, including only cities with at least 500 fire incidents)
| Oxford: | 7 minutes |
| Camden: | 10 minutes |
| Hamilton: | 5 minutes |
| Trenton: | 6 minutes |
| Fairfield: | 5 minutes |
| Harrison: | 6 minutes |
| Eaton: | 7 minutes |
| Forest Park: | 5 minutes |
| Middletown: | 5 minutes |
 According to the data from the years 2002 - 2018 the average number of fire-related yearly casualties is 1. The highest number of injuries - 8 took place in 2005, and the lowest - 0 in 2002. The data has a constant trend.
The average number of injuries per 1,000 fires is 9. This indicator was the highest - 116 in 2005, and the lowest 0 in 2002. The trend for casualties per 1,000 fires is constant. Compared to the state value the number of casualties per 1,000 fire incidents is much lower.
According to the data from the years 2002 - 2018 the average number of fire-related yearly casualties is 1. The highest number of injuries - 8 took place in 2005, and the lowest - 0 in 2002. The data has a constant trend.
The average number of injuries per 1,000 fires is 9. This indicator was the highest - 116 in 2005, and the lowest 0 in 2002. The trend for casualties per 1,000 fires is constant. Compared to the state value the number of casualties per 1,000 fire incidents is much lower.Casualties per 1,000 incidents in Oxford, OH compared to nearest cities:
(Note: Based on data for all years, including only cities with at least 500 fire incidents)
| Oxford: | 6.8 |
| Camden: | 8.3 |
| Hamilton: | 10.6 |
| Trenton: | 7.3 |
| Fairfield: | 10.8 |
| Harrison: | 11.1 |
| Eaton: | 12.7 |
| Forest Park: | 26.3 |
| Middletown: | 30.9 |
 35.7% incidents where reported in the morning and 64.3% in the evening. The most fires (16.9%) took place on Sunday, and the least (11.8%) on Wednesday.
 According to the 1,760 fire incident reports from years 2002 - 2018 most fires (10.9%) took place during May, and the least (5.5%) in July.
 Out of all 7,233 cases reported during the years 2002 - 2018, the most belonged to the categories: False Alarm (32.3%), Fire (24.3%), and Hazardous Condition (15.0%).
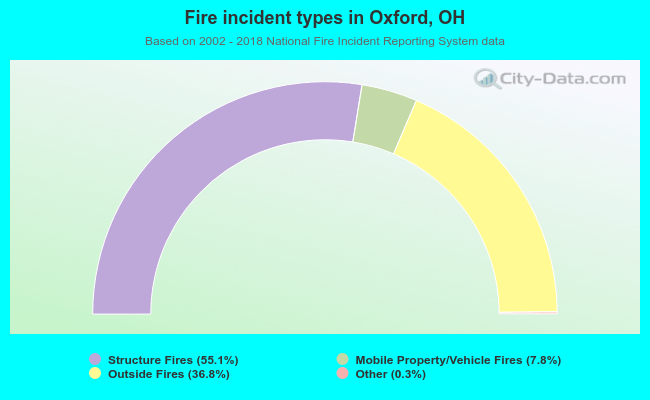 When looking into fire subcategories, the most reports belonged to: Structure Fires (55.1%), and Outside Fires (36.8%).