Pahrump: Fire Incidents, Nevada (NV)
Where are fire incidents reported in Pahrump, NV
Something went wrong! Please refresh the page.
| Fire incidents reported | |
|---|---|
| Sreet name | Count |
| HWY 160 | 144 |
| BLAGG RD | 74 |
| HOMESTEAD RD | 68 |
| WILSON RD | 58 |
| LESLIE ST | 56 |
| BASIN AVE | 54 |
| HWY 372 | 54 |
| CALVADA BLVD | 52 |
| BARNEY ST | 50 |
| BELL VISTA AVE | 50 |
| MESQUITE AV | 48 |
| MANSE RD | 46 |
| PAHRUMP VALLEY BLVD | 46 |
| BLOSSER RANCH RD | 38 |
| OAKRIDGE AV | 36 |
| GAMEBIRD RD | 34 |
| KELLOGG RD | 34 |
| SIMKINS RD | 34 |
| IRENE ST | 30 |
| CHARLESTON PARK AVE | 28 |
| THOUSANDAIRE BLVD | 28 |
| VICKI ANN RD | 28 |
| RETREAD RD | 26 |
| VONDELL DR | 26 |
| DONNER ST | 24 |
| LINDA ST | 24 |
| PAIUTE BLVD | 24 |
| DAVID ST | 22 |
| MURPHY ST | 22 |
| BETTY AVE | 20 |
| Other | 1,600 |
2002 - 2018 National Fire Incident Reporting System (NFIRS) incidents
- Incident types reported to NFIRS in Pahrump, NV
- 3,64230.0%Service Call
- 3,02524.9%Rescue & EMS
- 2,87823.7%Fire
- 8537.0%Good Intent Call
- 7956.6%Hazardous Condition
- 7516.2%False Alarm
- 1791.5%Special Incident
- Fire incident types reported to NFIRS in Pahrump, NV
- 1,41749.2%Outside Fires
- 79327.6%Structure Fires
- 55519.3%Mobile Property/Vehicle Fires
- 1133.9%Other
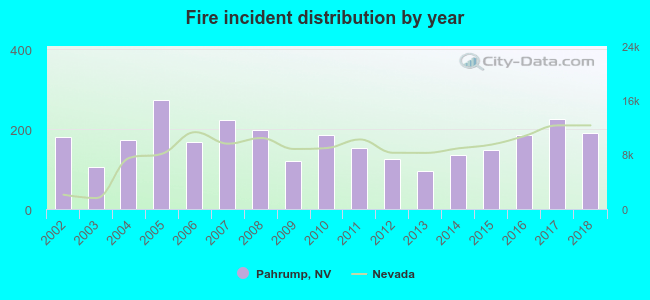 According to the data from the years 2002 - 2018 the average number of fires per year is 169. The highest number of fire incidents - 272 took place in 2005, and the least - 96 in 2013. The data has a growing trend.
The average number of yearly fire incidents per 10k residents in Pahrump, NV compared to nearest cities:
(Note: Based on data for the last 3 years, including only cities with population 5,000 and above)
| Pahrump: | 55.1 |
| Crystal: | 1.6 |
| Las Vegas: | 98.2 |
| North Las Vegas: | 41.9 |
| Paradise: | 0.1 |
| Henderson: | 21.9 |
| Clark: | 0.3 |
| Boulder City: | 39.0 |
| Laughlin: | 53.3 |
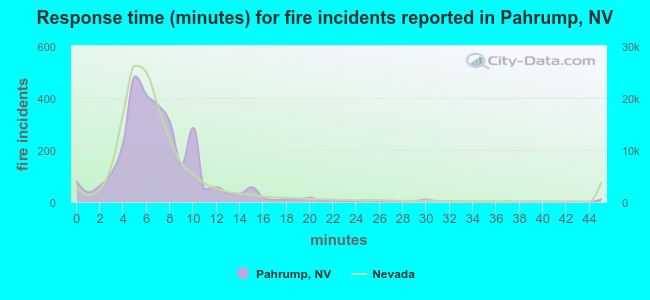 The median response time based on all reported fire incidents is 7 minutes. This is about the same as the Nevada median value.
The median response time in Pahrump, NV compared to nearest cities:
(Note: Based on data for all years, including only cities with at least 500 fire incidents)
| Pahrump: | 7 minutes |
| Las Vegas: | 6 minutes |
| North Las Vegas: | 6 minutes |
| Henderson: | 7 minutes |
| Boulder City: | 6 minutes |
| Ridgecrest: | 7 minutes |
| Laughlin: | 6 minutes |
| Bullhead City: | 5 minutes |
| Mohave Valley: | 7 minutes |
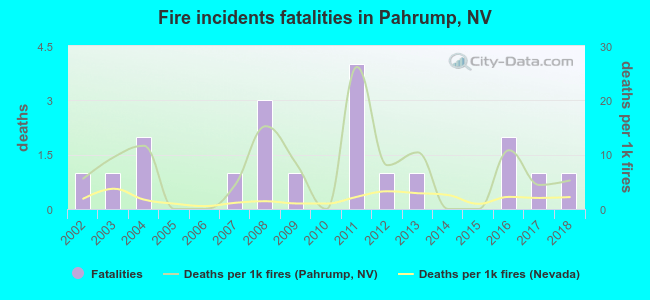 According to the reports from the years 2002 - 2018 the average number of fire-related fatalities per year is 1. The highest number of reported deaths - 4 took place in 2011, and the lowest - 0 in 2005. The data has a constant trend.
The average number of deaths per 1,000 fire incidents is 7. This indicator was the highest - 26 in 2011, and the lowest 0 in 2005. The trend for fatalities per 1,000 incidents is decreasing. Compared to the state value the number of fatalities per 1,000 fire incidents is much higher.
According to the reports from the years 2002 - 2018 the average number of fire-related fatalities per year is 1. The highest number of reported deaths - 4 took place in 2011, and the lowest - 0 in 2005. The data has a constant trend.
The average number of deaths per 1,000 fire incidents is 7. This indicator was the highest - 26 in 2011, and the lowest 0 in 2005. The trend for fatalities per 1,000 incidents is decreasing. Compared to the state value the number of fatalities per 1,000 fire incidents is much higher.Deaths per 1,000 incidents in Pahrump, NV compared to nearest cities:
(Note: Based on data for all years, including only cities with at least 2,500 fire incidents)
| Pahrump: | 6.6 |
| Las Vegas: | 1.1 |
| North Las Vegas: | 1.3 |
| Henderson: | 2.0 |
| Bullhead City: | 3.6 |
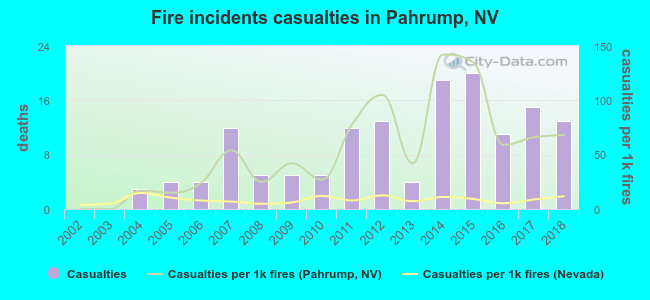 Based on the data from the years 2002 - 2018 the average number of fire-related casualties per year is 9. The highest number of reported casualties - 20 took place in 2015, and the lowest - 0 in 2002. The data has a rising trend.
The average number of injuries per 1,000 fire incidents is 53. This indicator was the highest - 142 in 2014, and the lowest 0 in 2002. The trend for casualties per 1,000 incidents is increasing. Compared to the state value the number of casualties per 1,000 fire incidents is much higher.
Based on the data from the years 2002 - 2018 the average number of fire-related casualties per year is 9. The highest number of reported casualties - 20 took place in 2015, and the lowest - 0 in 2002. The data has a rising trend.
The average number of injuries per 1,000 fire incidents is 53. This indicator was the highest - 142 in 2014, and the lowest 0 in 2002. The trend for casualties per 1,000 incidents is increasing. Compared to the state value the number of casualties per 1,000 fire incidents is much higher.Casualties per 1,000 incidents in Pahrump, NV compared to nearest cities:
(Note: Based on data for all years, including only cities with at least 500 fire incidents)
| Pahrump: | 50.4 |
| Las Vegas: | 8.7 |
| North Las Vegas: | 6.7 |
| Henderson: | 12.1 |
| Boulder City: | 0.0 |
| Ridgecrest: | 10.3 |
| Laughlin: | 25.3 |
| Bullhead City: | 33.9 |
| Mohave Valley: | 16.8 |
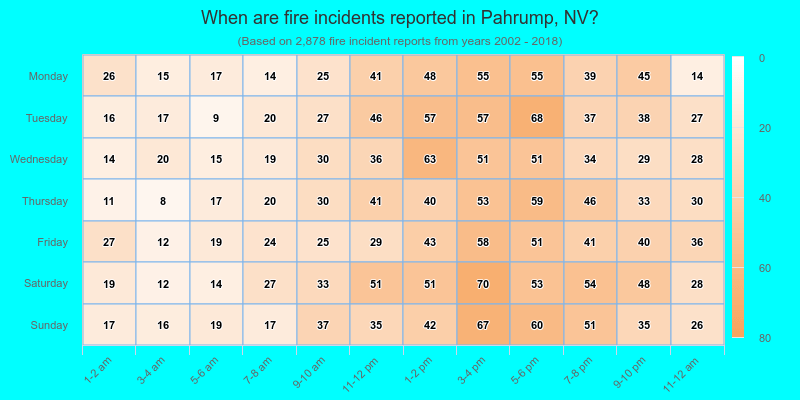
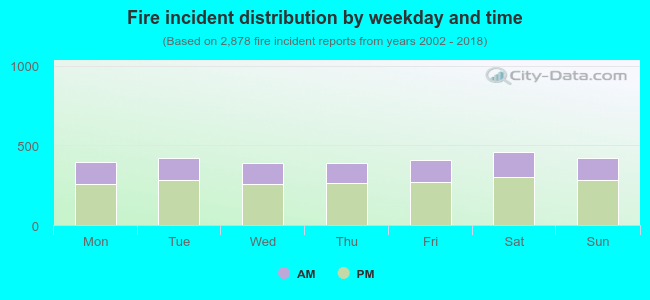 33.6% incidents where reported in the morning and 66.4% in the evening. The most fires (16.0%) took place on Saturday, and the least (13.5%) on Thursday.
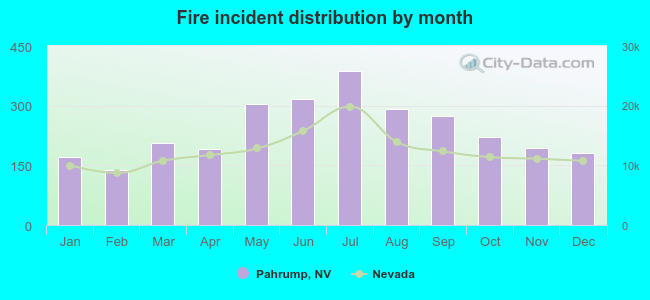 According to the 2,878 fire incident reports from years 2002 - 2018 most fires (13.4%) took place during July, and the least (4.8%) in February.
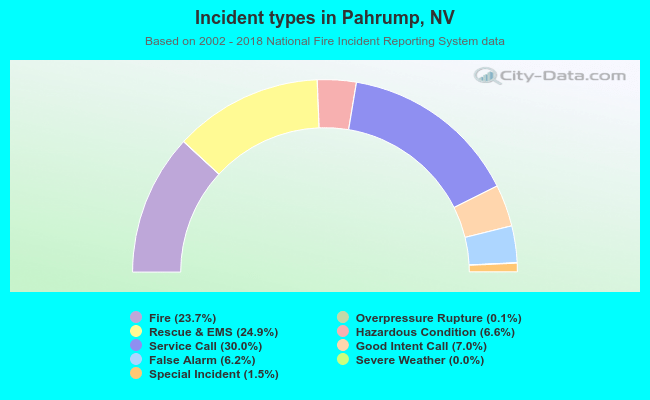 Out of all 12,136 cases reported during the years 2002 - 2018, the most belonged to the categories: Service Call (30.0%), Rescue & EMS (24.9%), and Fire (23.7%).
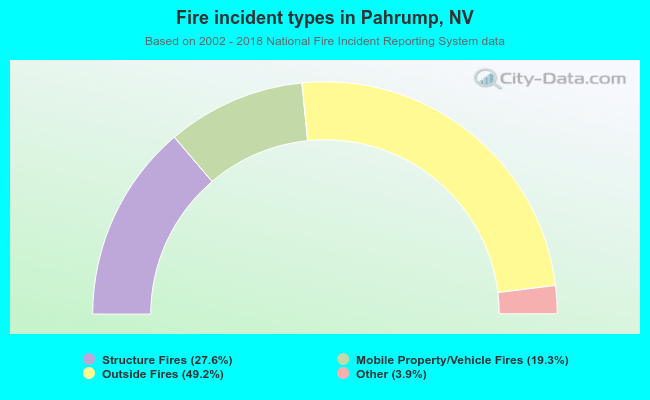 When looking into fire subcategories, the most reports belonged to: Outside Fires (49.2%), and Structure Fires (27.6%).