| Fire incidents reported |
|---|
| Sreet name | Count |
|---|
| VICTORY HWY | 28 | | ADDISON RD | 18 | | CREEKSIDE DR | 14 | | MEADS CREEK RD | 12 | | ERWIN HOLLOW RD | 10 | | BEARTOWN RD | 8 | | ERWIN HOLLOW RD. | 6 | | HIGH ST | 6 | | INTERSTATE 86 | 6 | | CHEMUNG ST | 4 | | DISCOVERY DR. | 4 | | DRY RUN RD | 4 | | ERWIN HOLLOW RD | 4 | | FOREST DRIVE | 4 | | HAMILTON ST | 4 | | MANNING RIDGE RD | 4 | | MAPLE DR | 4 | | MULHOLLAND RD | 4 | | PIONEER RD | 4 | | SCIENCE CENTER DR | 4 | | SCIENCE CENTER DR. | 4 | | SULLIVAN PARK | 4 | | WEST WATER ST | 4 | | 10 KNOLLBROOK LANE EAST | 2 | | 1068 THOMPSON RD. | 2 |
| | | Fire incidents reported |
|---|
| Sreet name | Count |
|---|
| 110 BROOK RD. | 2 | | 202 WEST WATER | 2 | | 210 GRAY LANE | 2 | | 2412 MULLHOLAND RD. | 2 | | 2431 TWIN OAKS RD. | 2 | | 2566 SCOTT ROAD | 2 | | 3 INDIAN PIPE | 2 | | 3170 S. HAMILTON ST. | 2 | | 36 BEARTOWN RD. | 2 | | 4262 MANNING RIDGE RD. | 2 | | 445 SOUTH HAMILTON ST. | 2 | | 5 TALL MEADOW | 2 | | 52 CLARK ST. | 2 | | 780 ADDISON RD. | 2 | | 9168 ADDISON ROAD | 2 | | 9591 CHATFIELD PLACE | 2 | | ADDISON RD | 2 | | ADDISON RD. | 2 | | AURENE DR | 2 | | BEARTOWN RD. | 2 | | BEEMAN HOLLOW RD | 2 | | BIRCH CIR | 2 | | BRONSON ST | 2 | | BROOK RD | 2 | | |
|
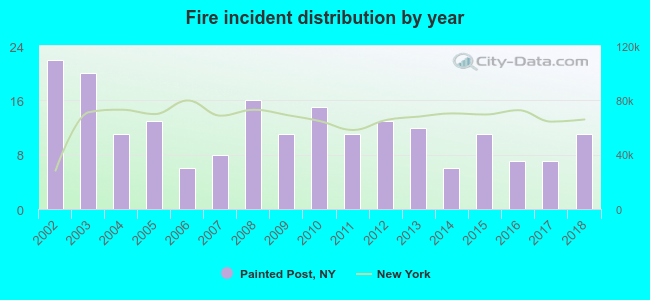 Based on the data from the years 2002 - 2018 the average number of fires per year is 12. The highest number of reported fire incidents - 22 took place in 2002, and the least - 6 in 2006. The data has a declining trend.
 31.0% incidents where reported in the morning and 69.0% in the evening. The most fires (20.5%) took place on Monday, and the least (8.0%) on Saturday.
 Based on the 200 fire incident reports from years 2002 - 2018 most fires (15.5%) took place during April, and the least (5.0%) in October.
 Out of all 1,974 cases reported during the years 2002 - 2018, the most belonged to the categories: Rescue & EMS (37.4%), Hazardous Condition (20.0%), and False Alarm (12.9%).
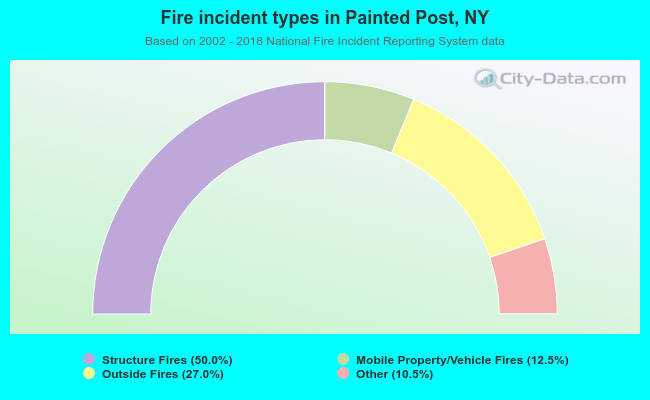 When looking into fire subcategories, the most reports belonged to: Structure Fires (50.0%), and Outside Fires (27.0%).