Palenville: Fire Incidents, New York (NY)
Where are fire incidents reported in Palenville, NY
Something went wrong! Please refresh the page.
|
| |||||||||||||||||||||||||||||||||||||||||||||||||||||||||||||||||||||||||
2002 - 2018 National Fire Incident Reporting System (NFIRS) incidents
- Incident types reported to NFIRS in Palenville, NY
- 44460.0%Rescue & EMS
- 12116.4%Fire
- 9212.4%Hazardous Condition
- 304.1%False Alarm
- 233.1%Service Call
- 212.8%Good Intent Call
- 50.7%Special Incident
- 30.4%Severe Weather
- 10.1%Overpressure Rupture
- Fire incident types reported to NFIRS in Palenville, NY
- 6553.7%Structure Fires
- 3831.4%Outside Fires
- 119.1%Mobile Property/Vehicle Fires
- 75.8%Other
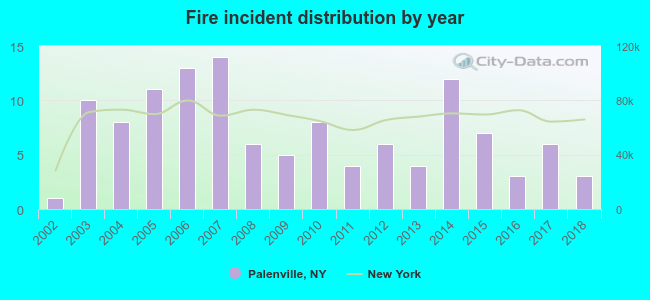 Based on the data from the years 2002 - 2018 the average number of fires per year is 7. The highest number of reported fire incidents - 14 took place in 2007, and the least - 1 in 2002. The data has a rising trend.
 28.9% incidents where reported in the morning and 71.1% in the evening. The most fires (18.2%) took place on Monday, and the least (9.9%) on Wednesday.
 Based on the 121 fire incident reports from years 2002 - 2018 most fires (19.8%) took place during April, and the least (3.3%) in October.
 Out of all 740 cases reported during the years 2002 - 2018, the most belonged to the categories: Rescue & EMS (60.0%), Fire (16.4%), and Hazardous Condition (12.4%).
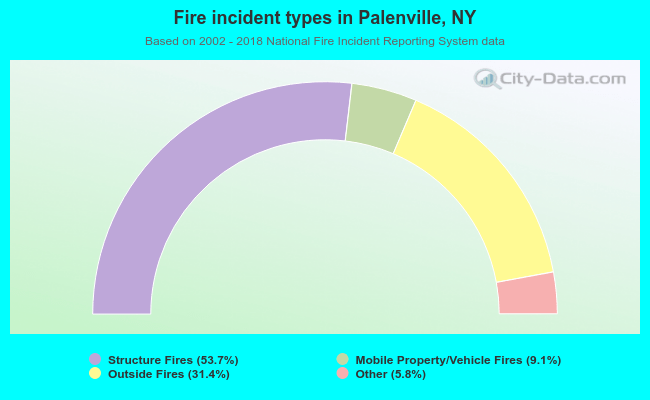 When looking into fire subcategories, the most reports belonged to: Structure Fires (53.7%), and Outside Fires (31.4%).